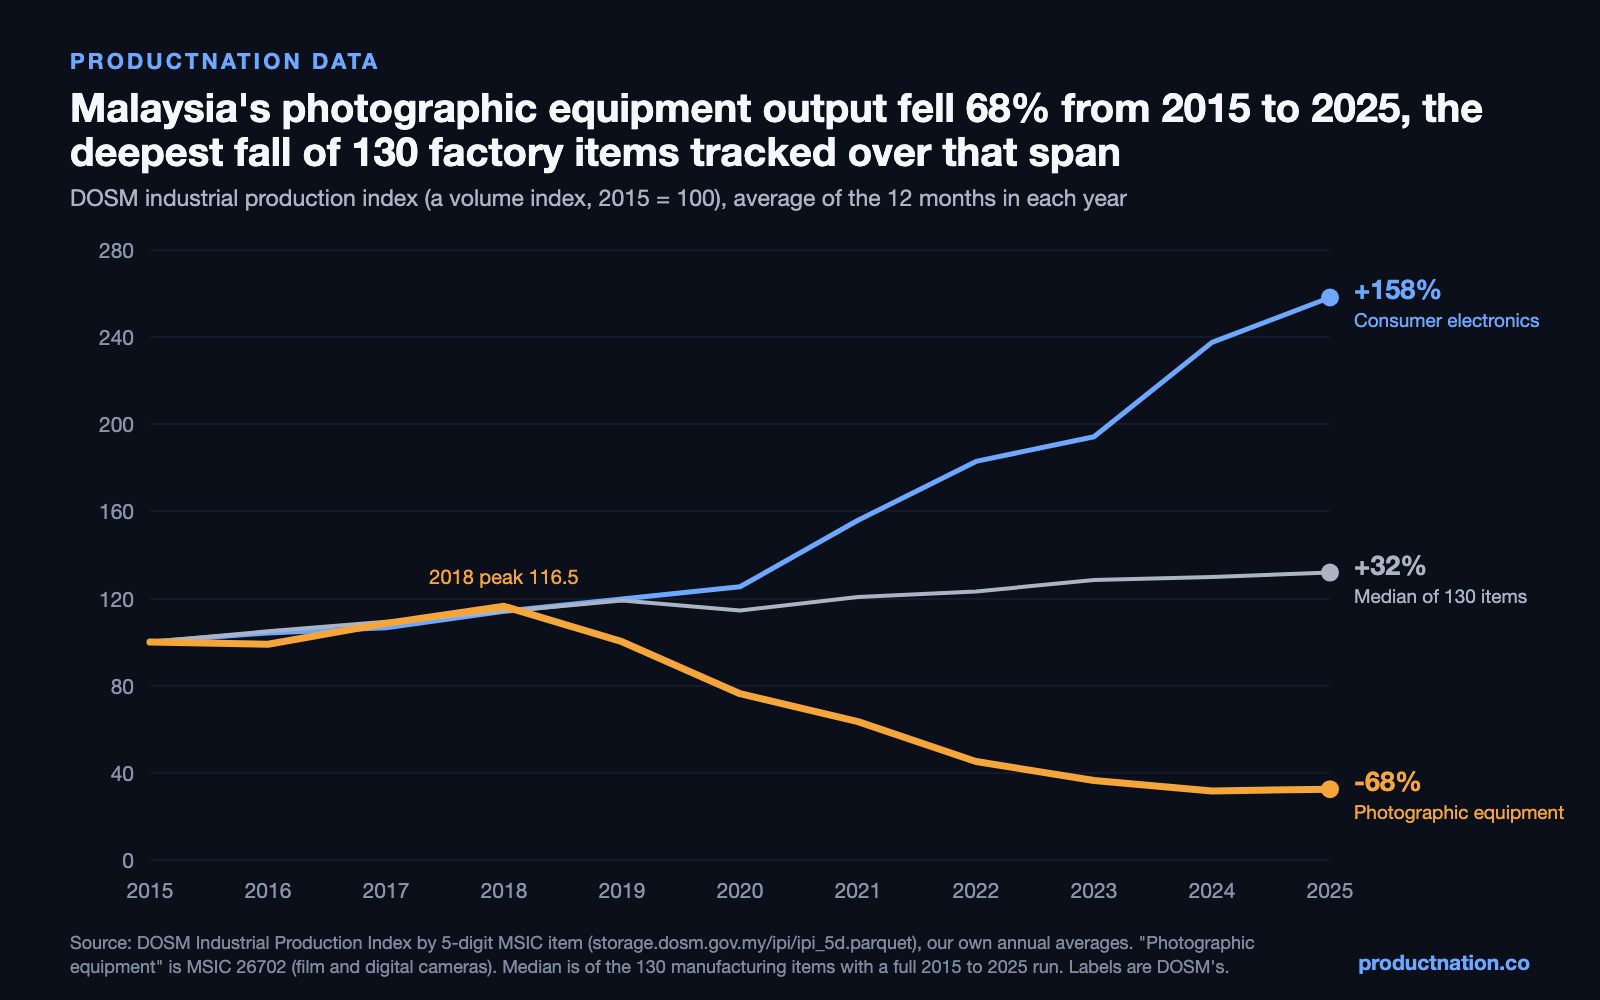
Malaysian factories produce far less photographic equipment than they did a decade ago, and among the 130 manufacturing items in DOSM's industrial production index with a full run from 2015 to 2025, none fell further. In the Department of Statistics Malaysia (DOSM) index, the item "manufacture of photographic equipment" (MSIC 26702) averaged 100.0 in 2015 and 32.5 in 2025, a fall of 67.5 per cent, the deepest fall of those 130 items. The median of the 130 items rose 31.9 per cent over the same years, and "manufacture of consumer electronics" (MSIC 26400) rose 158.2 per cent.
Every figure here uses the same two full calendar years: the average of the twelve monthly index readings for January to December 2015, against the same for 2025. The industrial production index is a volume index with 2015 set at 100. It measures how much is produced, not its value in ringgit, and not a count of units. DOSM's figures for the latest year can be revised, so the 2025 and 2026 readings here are as published on 6 November 2026 and may change.
Contents
What "photographic equipment" covers
Item 26702 is wider than cameras. In DOSM's Malaysia Standard Industrial Classification (MSIC 2008), which follows the United Nations classification (ISIC Rev. 4, class 2670), photographic equipment covers film and digital cameras together with motion-picture and slide projectors, overhead-transparency projectors and other photographic equipment. DOSM's online dictionary note for the item lists only the cameras. Either way, we read this index as photographic equipment as DOSM labels it, not as cameras alone. The same dictionary sends some cameras elsewhere: household-type video cameras are classed under consumer electronics (2640) and commercial TV and video cameras under communication equipment (2630).
The two electronics lines, year by year
Both items sit in the same DOSM manufacturing division, 26 (computer, electronic and optical products). They followed broadly similar paths through 2018, and the gap between them widened every year after that.
| Year | Photographic equipment (26702) | Consumer electronics (26400) | Median of 130 manufacturing items |
|---|---|---|---|
| 2015 | 100.0 | 100.0 | 100.0 |
| 2016 | 99.0 | 104.2 | 105.0 |
| 2017 | 108.6 | 106.6 | 109.3 |
| 2018 | 116.5 | 114.2 | 114.2 |
| 2019 | 100.2 | 119.8 | 119.2 |
| 2020 | 76.3 | 125.4 | 114.6 |
| 2021 | 63.5 | 155.9 | 120.7 |
| 2022 | 45.2 | 183.0 | 123.2 |
| 2023 | 36.5 | 194.3 | 128.5 |
| 2024 | 31.7 | 237.6 | 130.0 |
| 2025 | 32.5 | 258.2 | 131.9 |
The photographic equipment index peaked in 2018 at 116.5. It fell in each of the six years from 2019 to 2024, and by 2025 it stood 72.1 per cent below that 2018 peak. Its 2025 average, 32.5, was slightly above 2024's 31.7.
The deepest falls among 130 manufacturing items, 2015 to 2025
| DOSM item (MSIC) | Change, 2015 to 2025 |
|---|---|
| Manufacture of photographic equipment (26702) | -67.5% |
| Manufacture of bearings, gears, gearing and driving elements (28140) | -52.0% |
| Manufacture of printing ink (20222) | -48.0% |
| Manufacture of seamless tubes (24103) | -46.3% |
| Manufacture of plastic tableware, kitchenware and toilet articles (22205) | -45.5% |
| Manufacture of envelopes and letter-card (17091) | -39.5% |
Of the 130 items, 35 were lower in 2025 than in 2015 and 95 were higher. The next deepest fall, bearings and gears, is 15.5 percentage points shallower than photographic equipment. The other part of the same DOSM group 267, "manufacture of optical instruments and equipment" (26701), rose 12.1 per cent from 2015 to 2025. The combined group 267, optical instruments and photographic equipment, fell 32.7 per cent (100.0 in 2015, 67.3 in 2025, on DOSM's group-level index).
2026 so far
On matched months, January to August, the photographic equipment index averaged 39.2 in 2026 against 31.3 in 2025, up 25.2 per cent. The August 2026 reading, 59.7, is the highest monthly reading since December 2021 (61.9). Eight months is a part year, and this monthly item series moves a lot from month to month (it ranged from 27.8 to 59.7 within 2026 alone), so we do not read a recovery into it yet. On the same January to August months, the 2026 average is 54.7 per cent below January to August 2015 (86.5).
What this does and does not show
This is DOSM's index of production volume for one MSIC item. It does not show how many cameras were made, what they were worth, or how much of Malaysia's factory output this item represents: the item-level file we used carries no item weights, so we make no claim here about the size of the industry. It does not show which companies produce in this class, or why output fell; the index does not record causes, and we do not assign one. It is not a measure of camera sales or prices in Malaysia. DOSM's class description names film and digital cameras; it does not tell us where every camera part or lens made in Malaysia is classed, so this is not a measure of all camera-related manufacturing.
Related reading
These two pieces use different DOSM datasets, and we do not combine them with this one or claim they prove each other. Our look at factory-gate producer prices by manufacturing group since 2010 (DOSM producer price index) covers what factories charge, not how much they make. Our cinema, TV and audio price stack (DOSM consumer price index) covers what consumers pay.
How to reproduce this
Download DOSM's industrial production index by 5-digit item from storage.dosm.gov.my/ipi/ipi_5d.parquet, keep the series "abs" (the index level), keep items whose first two digits are 10 to 33 (manufacturing; 130 items, all with twelve readings in both 2015 and 2025), average the twelve monthly readings in each year, and compare. Item labels are in DOSM's MSIC dictionary, storage.dosm.gov.my/dictionaries/msic.parquet. The group-level figures are from storage.dosm.gov.my/ipi/ipi_3d.parquet. Our figures use the files as downloaded on 6 November 2026; a later DOSM revision can change them.