Going out to watch something in Malaysia has become much more expensive over the past 16 years, while what you watch on at home has become cheaper. We pulled the most detailed level of the Department of Statistics Malaysia (DOSM) Consumer Price Index, the subclass level, and compared September 2010 with September 2026, the latest month published. Every line below uses those same two months, from the same index.
These are price index numbers, not ringgit amounts. An index follows the price of the items DOSM tracks in each category over time. It is not the average ticket or the average phone, and it does not tell you why a price moved. All figures are from the official Consumer Price Index; none are from our own data.
Contents
- 1. Cinema prices rose 77.7 per cent, more than twice the rise in prices overall
- 2. Mobile phone prices fell 47.3 per cent
- 3. TV, audio and video equipment fell 28.3 per cent
- 4. Cinema prices rose faster than food prices
- 5. Subscriptions to audio-visual content and streaming rose 43.8 per cent
- 6. Computers, laptops and tablets fell 10.7 per cent
- 7. Mobile plans fell 8.1 per cent
- 8. Home internet was flat: up 0.7 per cent in 16 years
- All eight lines in one table
- What this does and does not say
- How to reproduce this
1. Cinema prices rose 77.7 per cent, more than twice the rise in prices overall
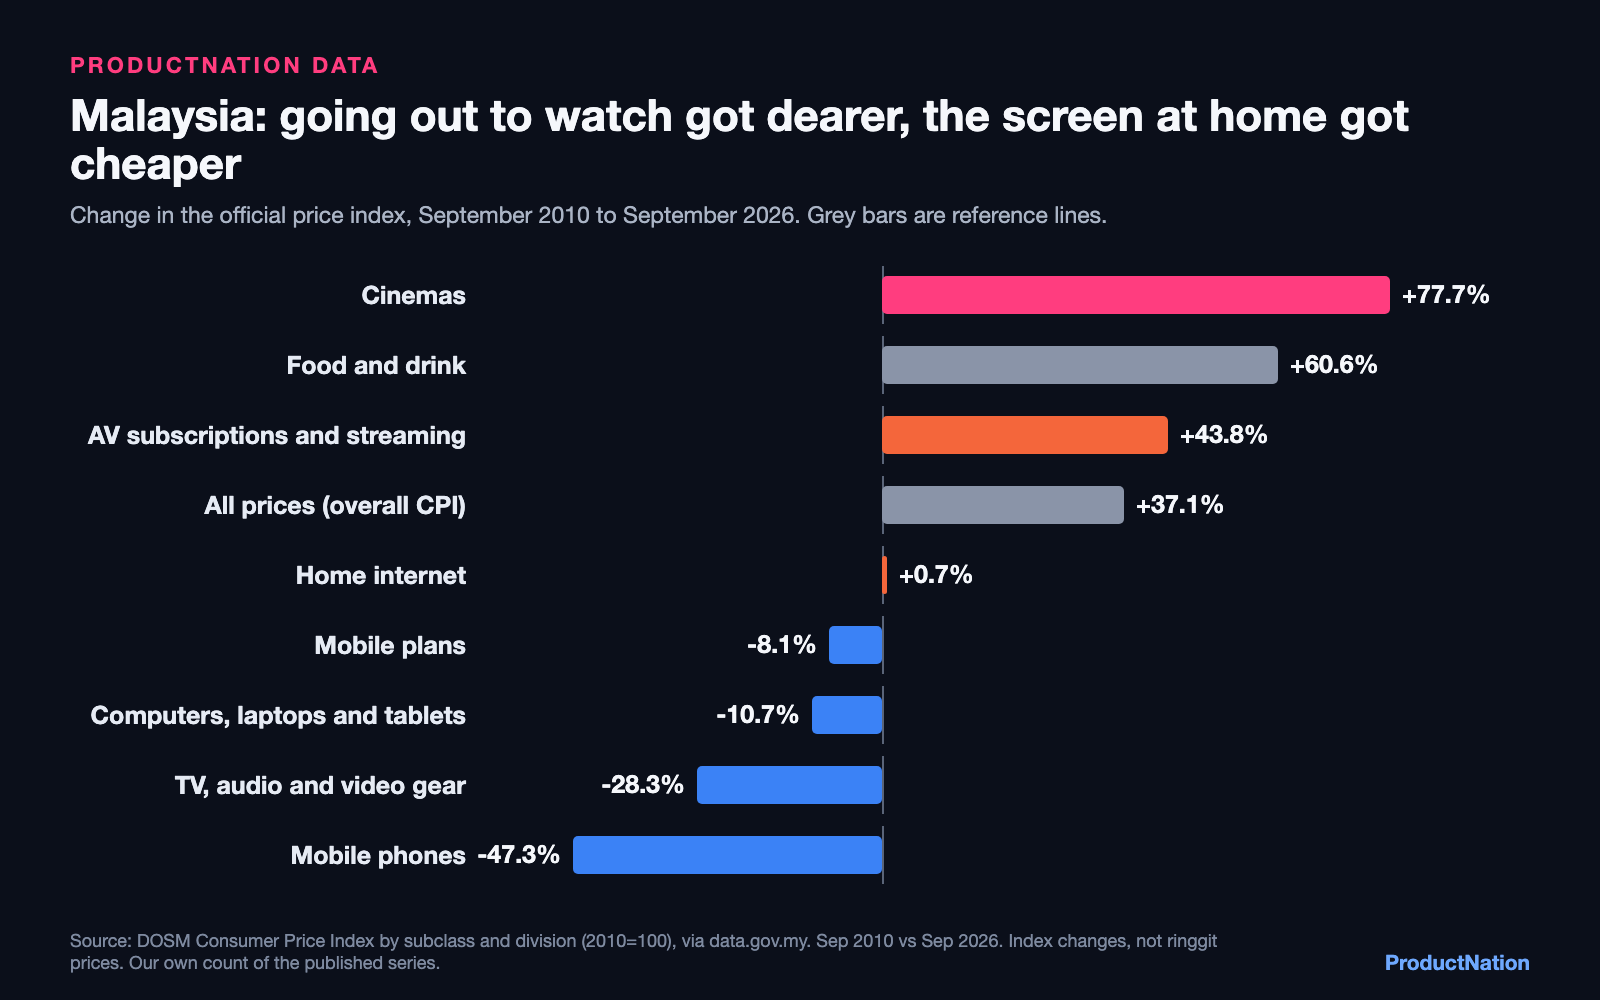
DOSM's index for services provided by cinemas went from 100.7 in September 2010 to 178.9 in September 2026, a rise of 77.7 per cent. Over the same two months the overall Consumer Price Index rose 37.1 per cent (100.4 to 137.6). The cinema index rose faster than every other line in this list.
The rise was not even. Taking September readings each year, the cinema index was at 139.6 in 2018 and 138.6 in 2021, then jumped to 163.1 in September 2022. That one 12-month step, 24.5 index points, is nearly a third of the 78.2-point rise across the full 16 years.
2. Mobile phone prices fell 47.3 per cent
DOSM's index for mobile telephone equipment fell from 100.4 to 52.9, the steepest fall of any line here. This is the phone itself, not the plan. It is a different measure from the 8.9 per cent fall we reported for the whole information and communication division in an earlier piece: that division also includes telecom services, and it ran over a different window (January 2010 to August 2026).
3. TV, audio and video equipment fell 28.3 per cent
DOSM's index for equipment for the reception, recording and reproduction of sound and vision, the category for televisions and home audio and video equipment, fell from 98.8 to 70.8. So over the same 16 years in which cinema prices rose 77.7 per cent, the index for the screen and speakers at home fell 28.3 per cent.
4. Cinema prices rose faster than food prices
The food and beverages division, the largest part of household spending, rose 60.6 per cent (100.5 to 161.4). The cinema index rose 77.7 per cent over the same months.
5. Subscriptions to audio-visual content and streaming rose 43.8 per cent
DOSM's index for subscriptions to audio-visual content, streaming services and rentals of audio-visual content went from 100.0 to 143.8. That is DOSM's own label, and the index covers whatever DOSM tracks under it in each period; we do not break it down further. It was unchanged at 123.8 in every month from 2019 to 2023 on our reading of the monthly series, then rose to 143.8.
6. Computers, laptops and tablets fell 10.7 per cent
The index for computers, laptops and tablets fell from 99.9 to 89.2. That is a much smaller fall than for phones.
7. Mobile plans fell 8.1 per cent
DOSM's index for mobile communication services went from 100.0 to 91.9. It sat at or near 100.0 for most of the period, apart from a rise to about 106 for part of 2015, and the fall began in October 2024.
8. Home internet was flat: up 0.7 per cent in 16 years
The index for internet access provision services went from 100.0 to 100.7. Over the same months, overall prices rose 37.1 per cent.
All eight lines in one table
| DOSM subclass or division | Code | Index Sep 2010 | Index Sep 2026 | Change |
|---|---|---|---|---|
| Services provided by cinemas | 09610 | 100.7 | 178.9 | +77.7% |
| Food & beverages (division) | 01 | 100.5 | 161.4 | +60.6% |
| Subscription to audio-visual content, streaming services & rentals of audio-visual content | 08392 | 100.0 | 143.8 | +43.8% |
| All items (overall CPI, for reference) | overall | 100.4 | 137.6 | +37.1% |
| Internet access provision services | 08330 | 100.0 | 100.7 | +0.7% |
| Mobile communication services | 08320 | 100.0 | 91.9 | -8.1% |
| Computers, laptops & tablets | 08131 | 99.9 | 89.2 | -10.7% |
| Equipment for the reception, recording & reproduction of sound & vision | 08140 | 98.8 | 70.8 | -28.3% |
| Mobile telephone equipment | 08120 | 100.4 | 52.9 | -47.3% |
What this does and does not say
It says that, on Malaysia's official price index, the cost of going to the cinema has risen much faster than prices in general, while the equipment people watch on at home, phones, televisions and audio and video gear, has fallen in price. It does not say why. An index can move because of what venues and shops charge, because of changes in the mix of items DOSM prices within a category, or because of how DOSM adjusts for changes in quality over time, and we have not separated those effects. It also does not say what a ticket or a television costs today in ringgit, and it does not measure how often Malaysians go to the cinema.
Each figure compares a single month, September 2010, with a single month, September 2026, so that every line shares one baseline and one end point. DOSM publishes these series with 2010 set to 100, so the September 2010 readings sit close to, but not exactly at, 100. All nine series run continuously, every month, from January 2010 to September 2026.
How to reproduce this
Download cpi_5d.parquet (the subclass-level index) and cpi_2d.parquet (the division-level index) from DOSM's open-data storage (storage.dosm.gov.my/cpi/), published through data.gov.my. For each subclass code in the table, read the index at 2010-09-01 and at 2026-09-01 and take the percentage change. Food and beverages is division 01 and all items is "overall" in cpi_2d. The English labels come from DOSM's MCOICOP lookup (storage.dosm.gov.my/dictionaries/mcoicop.parquet).