Since 2010, the price Malaysian factories charge for what they make has risen almost across the board. We counted every 3-digit manufacturing group in the Department of Statistics Malaysia (DOSM) Producer Price Index, the measure of factory-gate prices, and of the 53 groups with a full run of data from January 2010 to September 2026, only five end the period with their output priced below where it started. Two of those five are in the same place: the division that makes computers, electronics and optical products.
The two deepest cuts of all 53 groups are measuring, testing, navigating and control equipment, together with watches and clocks (down 27.1 per cent), and consumer electronics (down 19.3 per cent). For comparison, the typical group ran the other way: across these same 53 manufacturing groups the median change was a rise of 22.5 per cent over the window, measured on the same index we use throughout (2010 set to 100).
Contents
These are producer prices, not shop prices. The index measures what producers in Malaysia charge for their output, not what a shopper pays at the till. So this is a finding about the factory gate, and it sits alongside, not on top of, what we have separately found on the consumer and services side (below).
One industry, two directions
The striking part is that the same division holds both ends of the range. Within DOSM's division 26, "computer, electronic and optical products", the producer-price change from January 2010 to September 2026 runs from down 27.1 per cent to up 151.6 per cent, the widest internal spread of any division in Malaysian manufacturing. The single biggest riser of all 53 full-run groups sits inside it too: irradiation, electromedical and electrotherapeutic equipment, up 151.6 per cent.
So the common assumption that electronics gets steadily cheaper is not true at Malaysia's factory gate as a statement about the whole industry. Among the division's groups we can track from 2010, only the consumer-electronics and instruments groups charge less than they did then. The producer prices for the rest of those groups, from computers and peripherals through communication equipment, optical and photographic equipment, and electronic components, to electromedical equipment, rose, some of them sharply. One group in the division, magnetic and optical media (268), has no 2010 reading and so cannot be placed on either side of the line.
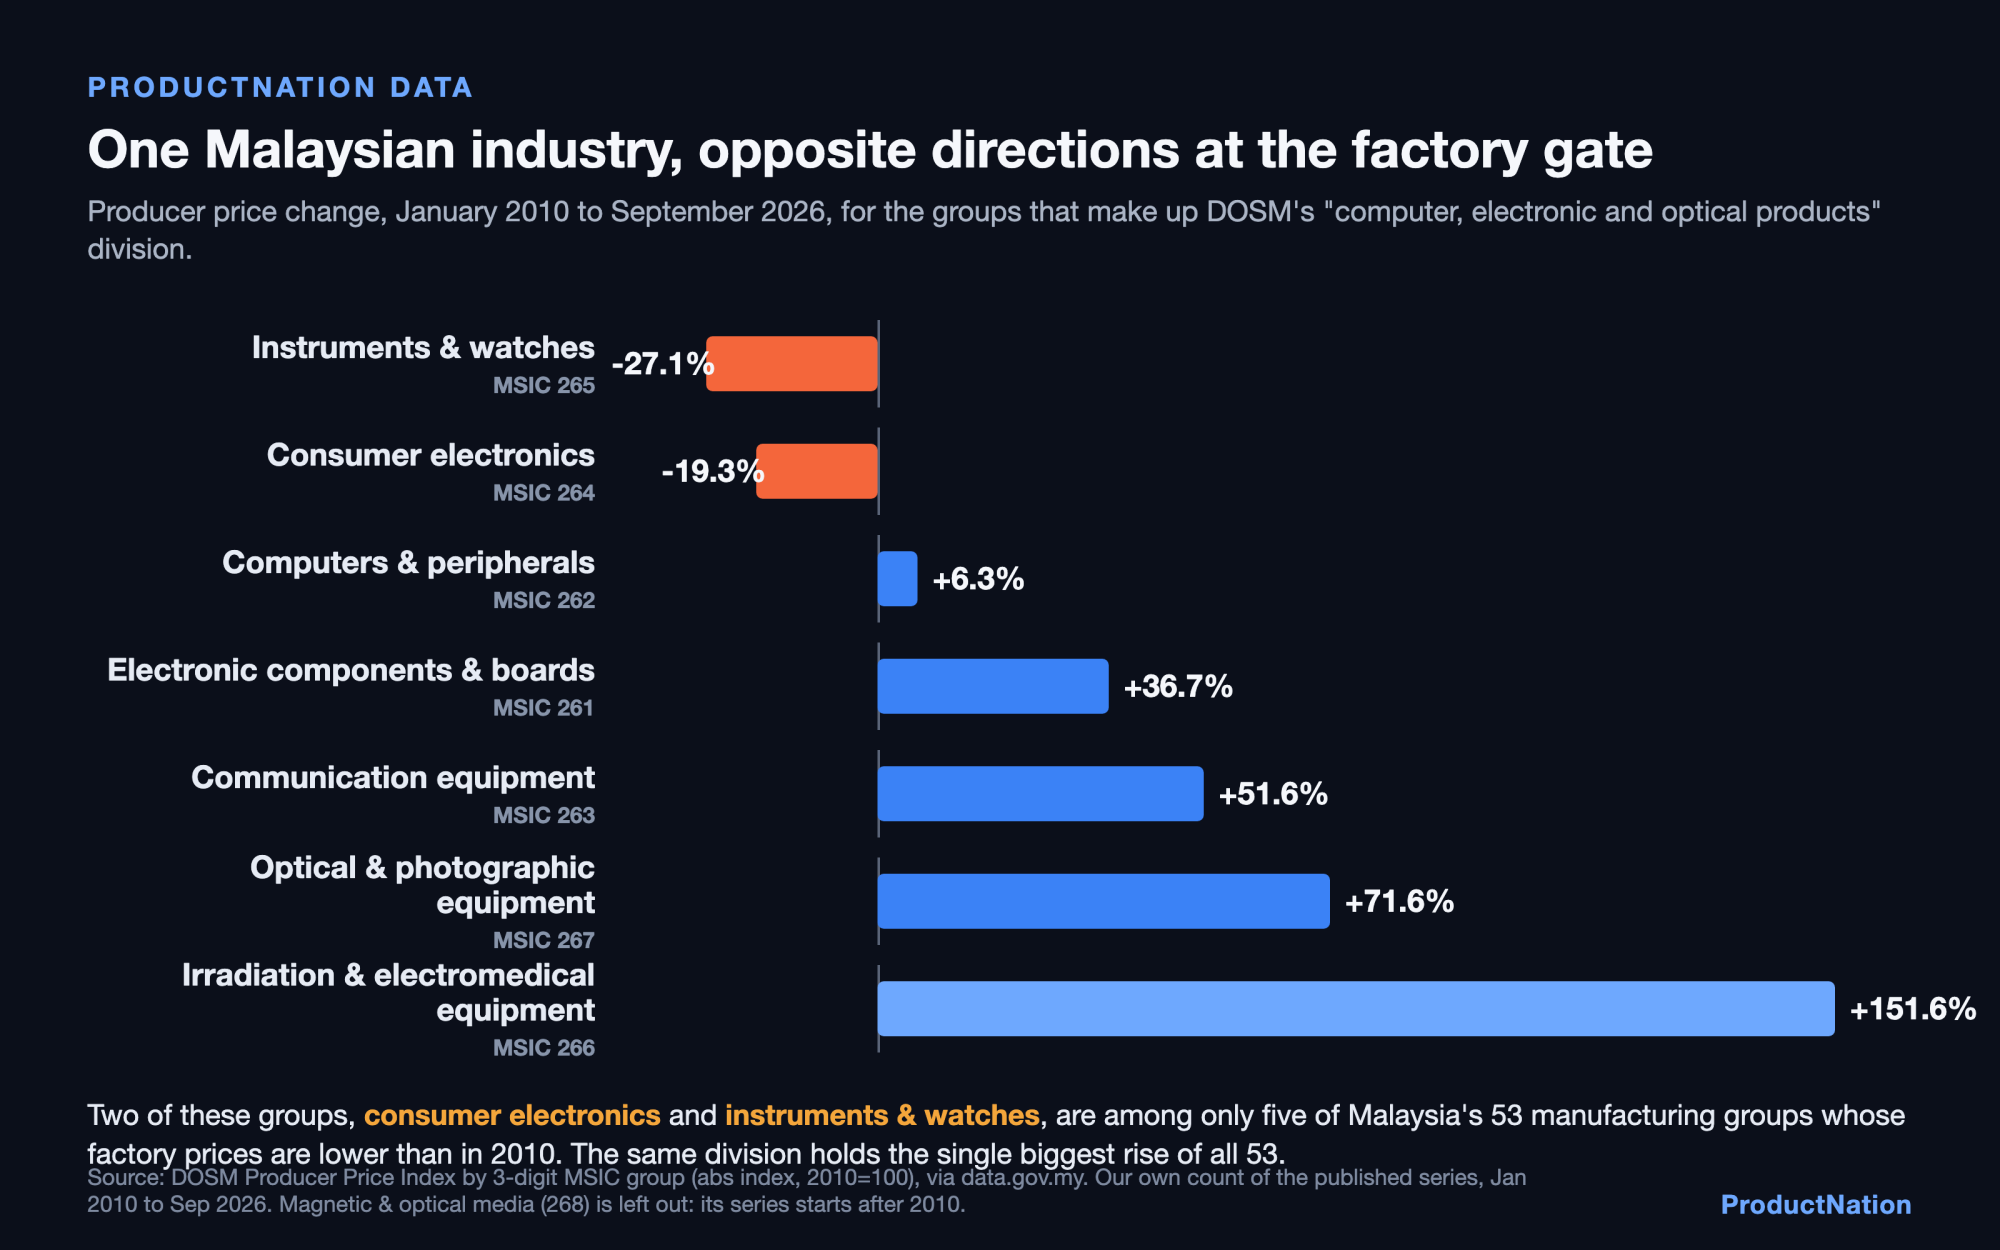
Here is every group in that division, with the index for January 2010, September 2026, and the change. The index is set to 100 for the 2010 annual average, so a single month's January 2010 reading can differ slightly from 100 (consumer electronics began that year at 99.3). Every change we quote is measured between the two dated readings, January 2010 and September 2026, not against the base of 100. Magnetic and optical media (group 268) is left out of the change column because its series begins after 2010 and has no 2010 base to compare against.
| MSIC group | What it makes | Index Jan 2010 | Index Sep 2026 | Change |
|---|---|---|---|---|
| 265 | Measuring, testing, navigating and control equipment; watches and clocks | 100.4 | 73.2 | -27.1% |
| 264 | Consumer electronics | 99.3 | 80.1 | -19.3% |
| 262 | Computers and peripheral equipment | 104.0 | 110.6 | +6.3% |
| 261 | Electronic components and boards | 105.4 | 144.1 | +36.7% |
| 263 | Communication equipment | 104.9 | 159.0 | +51.6% |
| 267 | Optical instruments and photographic equipment | 103.7 | 177.9 | +71.6% |
| 266 | Irradiation, electromedical and electrotherapeutic equipment | 103.4 | 260.2 | +151.6% |
The labels are DOSM's own, from its MSIC lookup; the codes are the standard 3-digit groups. "Consumer electronics" (group 264) is the official DOSM label for household audio and video equipment such as televisions and home-audio systems. Note that mobile phones are not in this group: DOSM classes telephone-making under communication equipment (group 263), which rose 51.6 per cent, so this is not a finding about the phone in anyone's pocket. Group 265 bundles precision instruments with watches and clocks under one heading, so the 27.1 per cent fall is for that combined group, not watches alone.
The five groups that fell, out of 53
Across all of manufacturing, the fallers are a short list. Three of the five are outside electronics.
| MSIC group | What it makes | Change, Jan 2010 to Sep 2026 |
|---|---|---|
| 265 | Measuring, testing, navigating and control equipment; watches and clocks | -27.1% |
| 264 | Consumer electronics | -19.3% |
| 181 | Printing and service activities related to printing | -12.7% |
| 282 | Special-purpose machinery | -8.9% |
| 151 | Tanning and dressing of leather; luggage, handbags, footwear and the like | -2.4% |
Every other group with a full run of data from 2010, the other 48, charges more at the factory gate now than it did in 2010, up to the 151.6 per cent rise in electromedical equipment.
What this does and does not say
This is the producer, or factory-gate, side of the price story, and it is one of three separate price pictures we have built from DOSM's own published indices. The other two sit on different datasets, over different windows and populations, so we do not combine them with the figures here, treat them as the same measurement, or claim they prove each other. We link them only as related reading, each worked in full in its own piece:
- The consumer side, from Malaysia's Consumer Price Index: Almost every price category in Malaysia rose since 2010, the phone basket fell 8.9 per cent.
- The business-services side, from DOSM's Services Producer Price Index: Nearly every service in Malaysia got pricier since 2015, telecoms rose just 0.4 per cent.
We do not claim a cause. A producer price index can move because of productivity, changes in the mix of products within a group, exchange rates, or global component cycles, so a fall in the index for consumer electronics is not by itself proof that any single device became cheaper to build or cheaper to buy. What we can say is what the published index shows: of 53 manufacturing groups, only five sit below their 2010 level, and the two deepest are both in the computer, electronic and optical division, which at the same time holds the biggest rise of all 53.
These are index numbers, not ringgit prices, so every figure here is a change in the index, not an amount of money. They also measure the prices producers receive at the factory gate, not the cost of making a product and not the retail price, so this is a finding about what factories charge, never directly about what anything costs to build or to buy. DOSM publishes this series as a single continuous index with 2010 set to 100; we checked that the electronics groups show no artificial one-month jump at a rebasing point and that their 2015 readings are not reset to 100, so the long comparison is against one continuous base. DOSM also marks its most recent months as provisional and open to revision, so the September 2026 endpoint may change in a later release.
How to reproduce this
Download the file ppi_3d.parquet from DOSM (storage.dosm.gov.my/ppi/ppi_3d.parquet, the "Monthly PPI by Group (3 digit)" dataset on data.gov.my). Keep the rows where the series is "abs" (the index level, 2010 = 100). For each 3-digit group, read the index at 2010-01-01 and at 2026-09-01 and take the percentage change. Group labels come from DOSM's MSIC lookup (storage.dosm.gov.my/dictionaries/msic.parquet, the 3-digit group to English-description mapping). The count of 53 is the number of groups that have both a January 2010 and a September 2026 reading; groups whose series begin after 2010, such as magnetic and optical media (268), are not counted in that comparison. The median rise of 22.5 per cent is the median of those 53 per-group changes, taken on the same series, so it is a like-for-like comparator rather than a different index.