Malaysia talks about its digital economy as a big number. The Department of Statistics Malaysia puts it at 23.4 per cent of GDP in 2024, through a separate framework called the ICT Satellite Account. That figure is real, and it is large. It is also a very broad measure.
We went to a different Department of Statistics record for the same year, the breakdown of GDP by economic subsector, and counted what Malaysia actually produces in each tech activity as a share of the whole economy. The subsector the statistics office files as computer and information service activities, the specialist firms that write code and run IT services for others, came to 1.22 per cent of GDP in 2024. In 2015 it was 1.25 per cent. On this measure it is a small slice of the economy, smaller than the phone network and far smaller than the chip factories.
Contents
What this subsector covers is worth being exact about, because the piece rests on it: computer programming, IT consulting, data processing, hosting and information services. Packaged-software publishing is counted elsewhere, under publishing, and software written in-house by a bank or a factory is not measured as this industry’s value added. So this is the specialist computer and IT-services industry as DOSM defines it, not every firm in the country that touches software. We use “software and IT services” below as the readable short name for that subsector.
These are two different measures and we do not subtract one from the other. The 23.4 per cent is a broad account that bundles the value created by all ICT hardware and telecommunications, plus the e-commerce value generated across every other industry, from retail to manufacturing. The 1.22 per cent is the value added of one subsector, software and IT services, inside the standard GDP accounts. Set side by side, they say something a single headline hides: among the tech activities we counted, the larger shares are in making electronics and running the phone network, not in software and IT services.
The stack: where Malaysia’s tech sits in GDP
Every line below is that subsector’s share of GDP, measured at current prices from the production side, in 2015 and again in 2024, the latest year for which the digital-economy headline and this subsector breakdown both exist. We counted it ourselves from the public file.
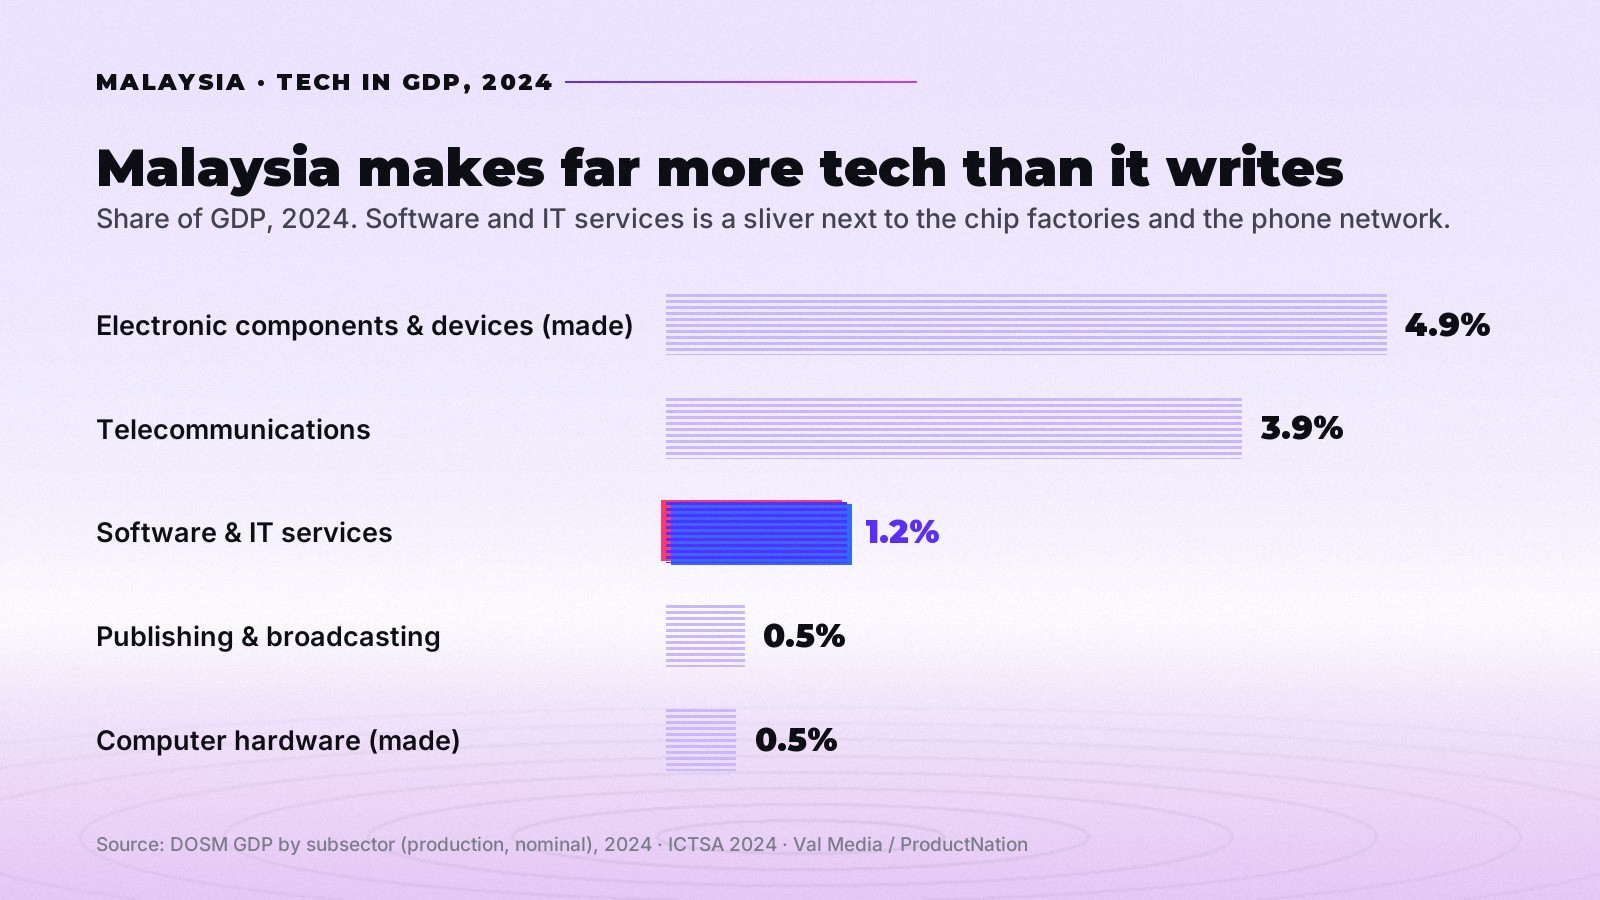
- Software and IT services was 1.2 per cent of GDP in 2024, a touch below its 1.25 per cent in 2015. The specialist computer and IT-services firms grew 61 per cent in nominal value added over the decade, slightly slower than the 64 per cent the whole economy grew, so their share eased rather than rose. On this measure, the part of the economy that is specifically the software and IT-services industry is a fraction of the figure the digital-economy headline suggests.
- Telecommunications was 3.9 per cent, three times software. The phone and data network rose from 3.48 to 3.90 per cent of GDP, and it is the largest single digital-services slice.
- Making electronic components and devices was 4.9 per cent, the largest single tech activity we counted. The semiconductor and components factories rose from 3.97 to 4.88 per cent of GDP, and their value added grew faster than any other slice here, up 102 per cent in nominal terms. This activity is itself part of the broader electrical and electronic manufacturing group below.
- All information and communication services together were 5.7 per cent. This is the parent group: publishing and broadcasting, telecommunications, and computer and IT services combined, up from 5.29 to 5.65 per cent. Telecommunications is the majority of it, about 69 per cent, software and IT services a far smaller part.
- All electrical and electronic manufacturing was 6.9 per cent, bigger than all of Malaysia’s information and communication services combined. Making electrical and electronic goods rose from 5.97 to 6.92 per cent of GDP, outweighing the entire information and communication services group: telecommunications, software and IT services, and publishing and broadcasting together.
- Making computer hardware was 0.5 per cent, barely changed. Computer manufacturing edged from 0.46 to 0.47 per cent of GDP; its value added grew 69 per cent, a little faster than the economy, so its slice held roughly steady.
- Publishing and broadcasting was 0.5 per cent, and slipped. It eased from 0.56 to 0.53 per cent of GDP, growing 54 per cent while the economy grew 64 per cent.
Why the software slice stayed small
The small share is not because software collapsed. Its value added, measured at current prices, grew 61 per cent between 2015 and 2024. But the whole economy grew 64 per cent over those nine years, so software grew a shade slower than the country, and its share of GDP eased from 1.25 to 1.22 per cent rather than rising. Telecommunications (up 84 per cent) and electronic components (up 102 per cent) grew faster than the economy from much larger bases, so their slices rose and pulled further ahead. We do not claim a reason for any of this; the record shows the size of each slice, not why it moved.
The numbers, year by year
The public file lets us take each subsector’s value and divide it by GDP for the same year. Because both the top and bottom of that fraction are in the same year’s current prices, no inflation adjustment is needed for the share. The growth column, by contrast, is nominal and includes price rises, which is why we lean on the share, not the growth, for the finding.
| Part of the economy | Share of GDP, 2015 | Share of GDP, 2024 | Growth in nominal value added, 2015 to 2024 |
|---|---|---|---|
| Software and IT services | 1.25% | 1.22% | +61% |
| Telecommunications | 3.48% | 3.90% | +84% |
| Making electronic components and devices | 3.97% | 4.88% | +102% |
| All information and communication services | 5.29% | 5.65% | +75% |
| All electrical and electronic manufacturing | 5.97% | 6.92% | +90% |
| Making computer hardware | 0.46% | 0.47% | +69% |
| Publishing and broadcasting | 0.56% | 0.53% | +54% |
| Whole economy (GDP) | 100% | 100% | +64% |
Some rows contain others and must not be added together. All information and communication services is the sum of telecommunications, software and IT services, and publishing and broadcasting. Making electronic components and devices and making computer hardware are both parts of all electrical and electronic manufacturing. We show each parent group and its parts to give a sense of scale, not to be stacked up.
Two measures, two scopes
It is worth being plain about the digital-economy figure, because it is the number most people have heard. It comes from the ICT Satellite Account, a separate Department of Statistics product that answers a broader question: how much of the economy’s value is digital in any form. For 2024, its latest full year, it reported the digital economy at 23.4 per cent of GDP (RM451.3 billion), made up of 13.9 per cent from the gross value added of ICT industries and another 9.5 per cent from the value added that businesses outside the ICT sector generate through e-commerce. In 2023 the same measure was 23.5 per cent. So the value a manufacturer or a retailer adds by selling online counts toward that figure, not just the output of ICT firms.
The subsector figures here answer a narrower question: of everything Malaysia produces, how much is the specialist computer and IT-services industry itself. The honest reading is not that one number is wrong and the other right. It is that the digital-economy headline is wide, while the specialist industry that builds and runs software and IT services is, on the GDP-subsector measure, about 1.2 per cent of the economy, and has sat near that level across the decade we can see.
The limits of this reading
Four limits belong on the record. First, the subsector breakdown is value added measured at current prices from the production side, so the shares are nominal value added over nominal GDP in the same year; they are not gross output, volume or real-terms figures. Second, DOSM marks its 2024 and 2025 subsector values as provisional, and the ICT Satellite Account for a full-year 2025 has not yet been published, so 2024 is the latest year on which both the digital-economy headline and this subsector comparison rest; the subsector series does run one year further, to a provisional 2025, where software and IT services reads 1.39 per cent of GDP, still a small slice. Third, the subsector DOSM files as computer and information service activities is the software, IT-services and information-services business; it is not computer hardware, which is a separate manufacturing subsector shown on its own line above, and it is not the same thing as the broad ICT Satellite Account. Fourth, the 23.4 per cent digital-economy figure and the subsector shares come from two different DOSM frameworks that measure different scopes, so we place them side by side for the same year and do not add, subtract or divide one by the other.
In an earlier piece we counted Malaysia’s services producer prices sector by sector; that story is about price, this one is about size. The plain fact here is that the specialist computer and IT-services industry is about 1.2 per cent of Malaysia’s economy, and has sat near that level across the decade we can measure. For that related reading, see our count of Malaysia’s services producer prices since 2015.
How to reproduce this
Download the annual GDP by economic subsector dataset from DOSM (file gdp_annual_nominal_supply_sub, at storage.dosm.gov.my; the data.gov.my catalogue mirror of this series is frozen at 2023, so use the DOSM file for the current vintage), keep the rows where the series is the absolute value at current prices, and read off each subsector’s value for 2015 and 2024 using the subsector lookup (id gdp_lookup) to match the codes to names. Divide each by the whole-economy value for the same year to get the share of GDP. The 23.4 per cent, 13.9 per cent and 9.5 per cent come from DOSM’s separately published ICT Satellite Account (Malaysia Digital Economy 2025 release), for 2024. Every subsector figure above is our own count of the public GDP file.