Much of the public conversation about Malaysia’s electricity right now is about data centres: the Johor build-out, the power and water they will draw, the new generation being planned to meet that demand. The numbers attached to that future are enormous. Tenaga Nasional reported that, as of September 2025, it had signed 49 electricity supply agreements with data-centre developers, representing about 7.1 gigawatts of contracted future demand, and the Energy Transition and Water Transformation Ministry has projected data-centre demand could reach 12.9 gigawatts by 2030 and 20.9 gigawatts by 2040.
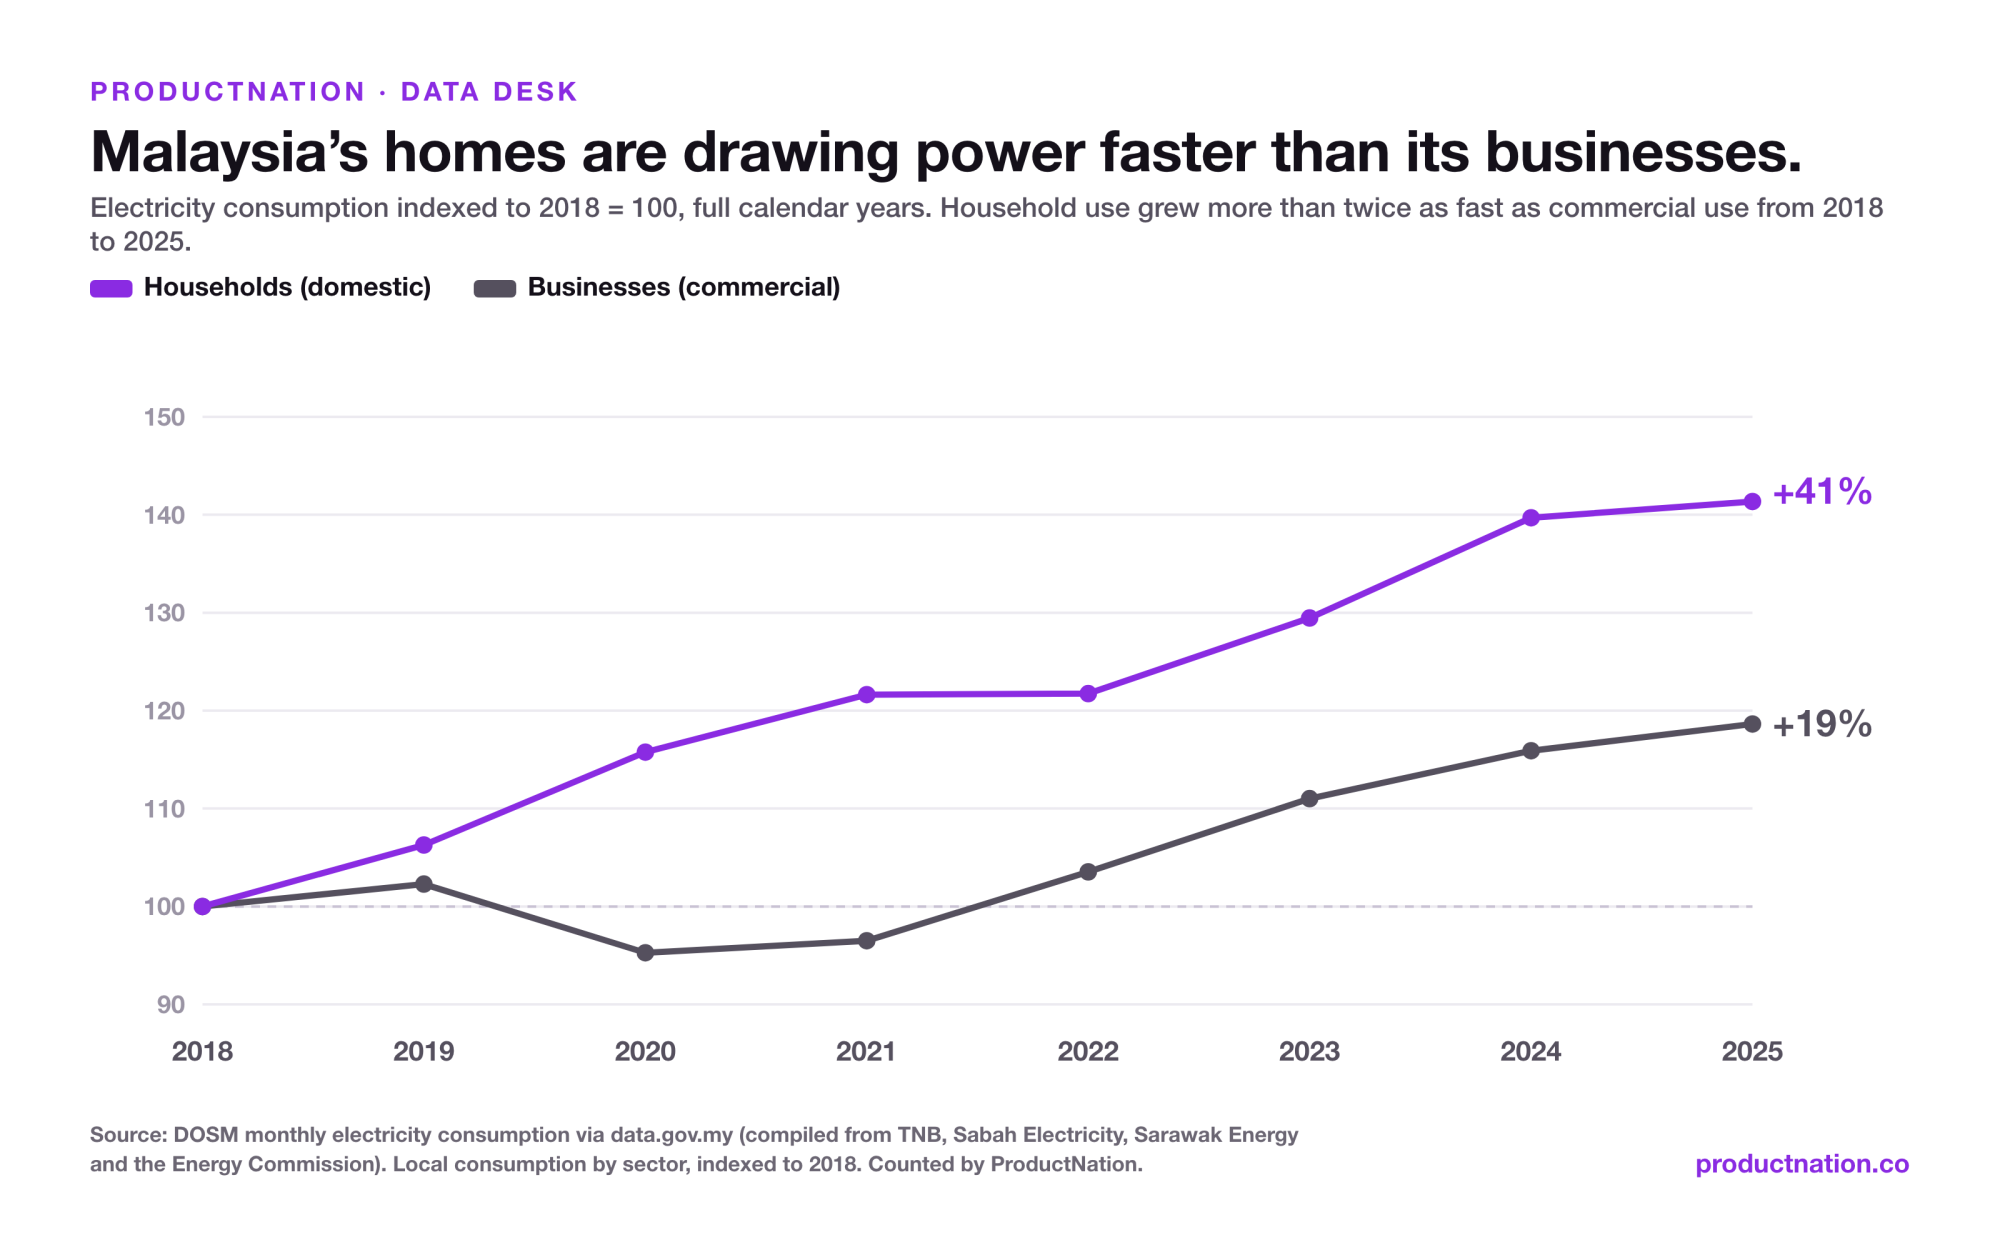
But those are commitments and projections about tomorrow’s grid. We went looking at the electricity Malaysia has actually consumed, and found a quieter story about today’s. Across the 2018 to 2025 calendar years, the country’s homes grew their electricity use by 41 per cent, more than double the 19 per cent rise in the commercial sector. Of the two groups the national data splits demand into, it is households, not business, that have grown faster. A data centre is a commercial or industrial user, not a residential one, so whatever it draws from the grid falls on the commercial side of this split, the side that grew more slowly.
Contents
What the national figures show
The data is the monthly electricity consumption series on data.gov.my, compiled by DOSM from the records of Tenaga Nasional, Sabah Electricity, Sarawak Energy and the Energy Commission. It splits national consumption into two end-use groups. The dataset’s own definitions matter here: the domestic category is residential use together with public lighting, and the commercial category covers industry and mining as well as commerce and services. We use “homes” as shorthand for domestic and “business” or “commercial” for the other, with those definitions in mind. We summed each group by calendar year and counted it ourselves.
| Year | Domestic (GWh) | Commercial (GWh) | Total local (GWh) |
|---|---|---|---|
| 2018 | 31,415 | 113,773 | 145,188 |
| 2019 | 33,386 | 116,369 | 149,755 |
| 2020 | 36,367 | 108,391 | 144,758 |
| 2021 | 38,213 | 109,794 | 148,007 |
| 2022 | 38,245 | 117,794 | 156,039 |
| 2023 | 40,671 | 126,307 | 166,978 |
| 2024 | 43,884 | 131,866 | 175,750 |
| 2025 | 44,409 | 134,970 | 179,379 |
| 2018 to 2025 | +41.4% | +18.6% | +23.5% |
Figures are in gigawatt-hours (the series reports millions of kilowatt-hours, the same unit), rounded to the nearest GWh, and the total is the sum of the two groups. DOSM marks its most recent six months as provisional and open to revision, so the January-to-June 2026 figures below may be adjusted slightly in later updates; the full calendar year 2025 sits outside that window and is treated as final. The gap is large enough that any small revision would not close it: by 2025 the domestic category was using 41 per cent more power than in 2018, while the far larger commercial category had added only 19 per cent.
The honest caveat: bigger is not the same as faster-growing
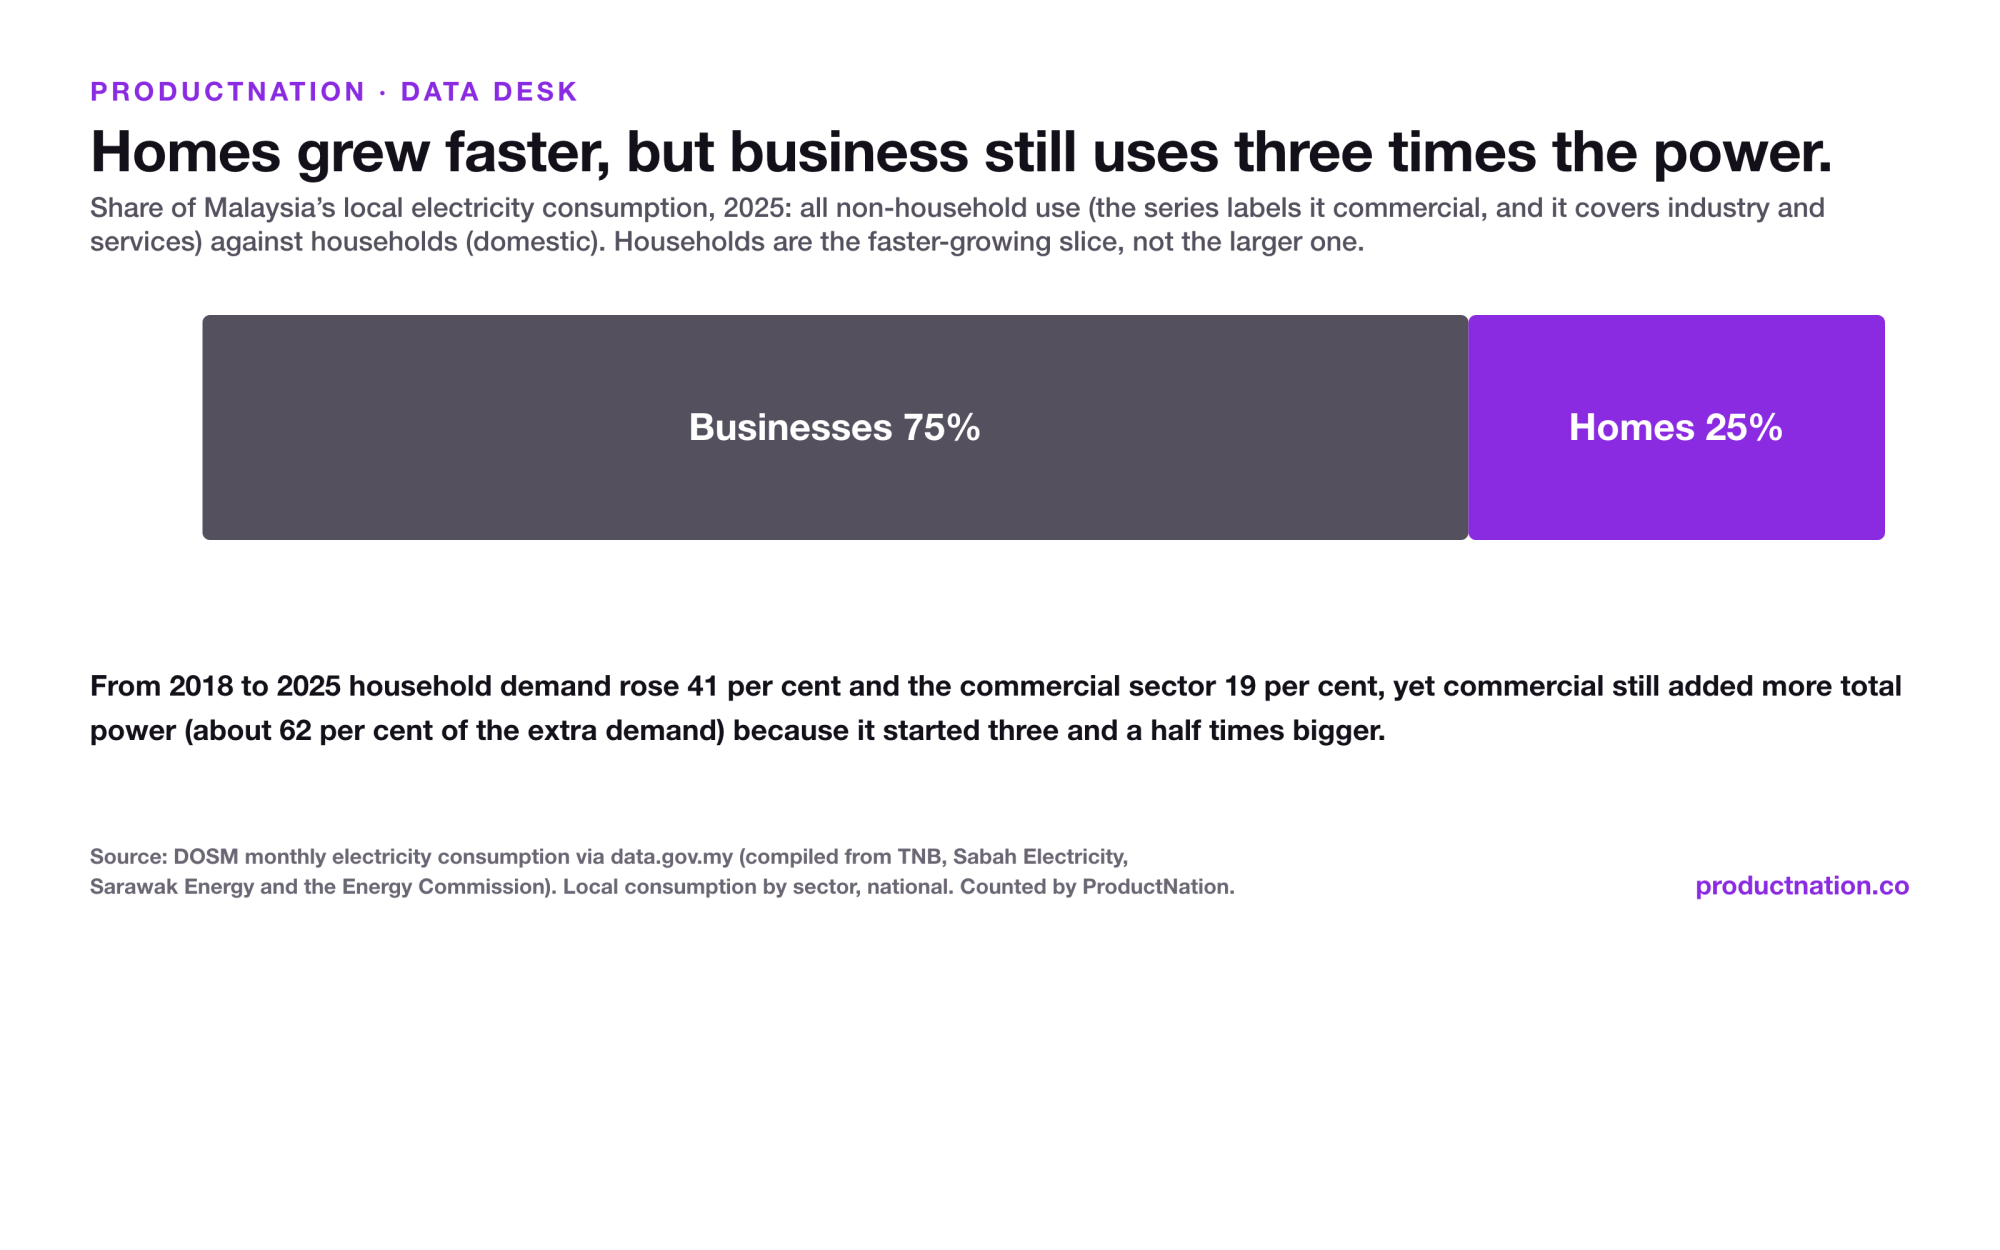
Two things have to be said plainly, because they pull in opposite directions. In percentage terms, homes grew about twice as fast. In absolute terms, the commercial category still added more new demand, because it started three and a half times larger. Of the roughly 34,000 GWh of extra local consumption between 2018 and 2025, commercial accounted for about 62 per cent and domestic about 38 per cent. Homes are the faster-growing slice, not the bigger one: in 2025 they were about a quarter of local consumption and the commercial category about three quarters.
A fair question is whether the household surge is just the pandemic: in 2020 and 2021, offices and malls went quiet while more electricity was drawn at home. Part of it is. Commercial consumption actually fell below its 2018 level in 2020 and 2021, and much of the rate gap opened in those years. But the pattern did not reverse afterwards. From 2022 to 2025, as activity reopened, domestic consumption still rose 16.1 per cent against the commercial category’s 14.6 per cent. And the freshest data carries it forward: on a matched January-to-June window, domestic consumption is up 51.7 per cent on 2018 (15,619 GWh to 23,700 GWh) and commercial up 26.7 per cent (55,568 GWh to 70,390 GWh) in the first half of 2026.
So where do the data centres fit?
The data-centre figures everyone quotes are about capacity being contracted and demand being projected, not power already consumed. The 7.1 gigawatts Tenaga has signed is contracted future supply, a different measure from the ministry’s 12.9-gigawatt demand projection for 2030, and both describe what may come rather than what the grid has delivered. What the actual consumption record shows is narrower and firmer: through 2025, with data centres already drawing from the grid as commercial and industrial users, the commercial category as a whole still grew more slowly than the domestic one.
So the data centre is set to matter enormously for the grid Malaysia is building, which is why Tenaga is signing supply agreements and planning years ahead. The record of the grid Malaysia already had reads differently and more quietly. The consumption series reports only the totals, not the reasons behind them, so it cannot say what drove the domestic rise. What it does say clearly is that the domestic category has pulled away from its 2018 baseline faster than the commercial one in every year since 2019.
If you want to see one corner of the digital economy those data centres are being built to serve, our look at how Malaysians actually get online, almost entirely by phone, sits on the same shelf.
How to check this yourself
Download the electricity consumption dataset from data.gov.my (data catalogue id electricity_consumption), keep the rows where the sector is local_domestic and local_commercial, and sum each by calendar year. Compare 2018 with 2025 for the headline change. The 2026 rows cover January to June only, so for a like-for-like figure we matched them against January to June of 2018 (domestic 15,619 against 23,700 GWh, commercial 55,568 against 70,390 GWh). The data-centre supply-agreement and demand-projection figures come from Tenaga Nasional’s September 2025 statements and the Energy Transition and Water Transformation Ministry, as reported by Bernama and Malaysian national media.