Measured by sales value, Malaysia's tech stores are the slowest-growing kind of shop in the country's official retail figures. In the Department of Statistics Malaysia (DOSM) monthly survey of retail trade, the group for "retail sale of information and communications equipment in specialized stores", the shops that sell computers, phones, software and audio and video equipment, took RM62.96 billion in sales in 2025. That is 21.0 per cent more than the RM52.03 billion it took in 2018. Over the same seven years, sales across all of Malaysian retail rose 62.3 per cent, from RM500.0 billion to RM811.5 billion.
DOSM splits retail into nine groups. Tech stores grew the least of all nine. Every figure in this comparison uses the same two full calendar years, January to December 2018 and January to December 2025, summed from DOSM's monthly sales.
Contents
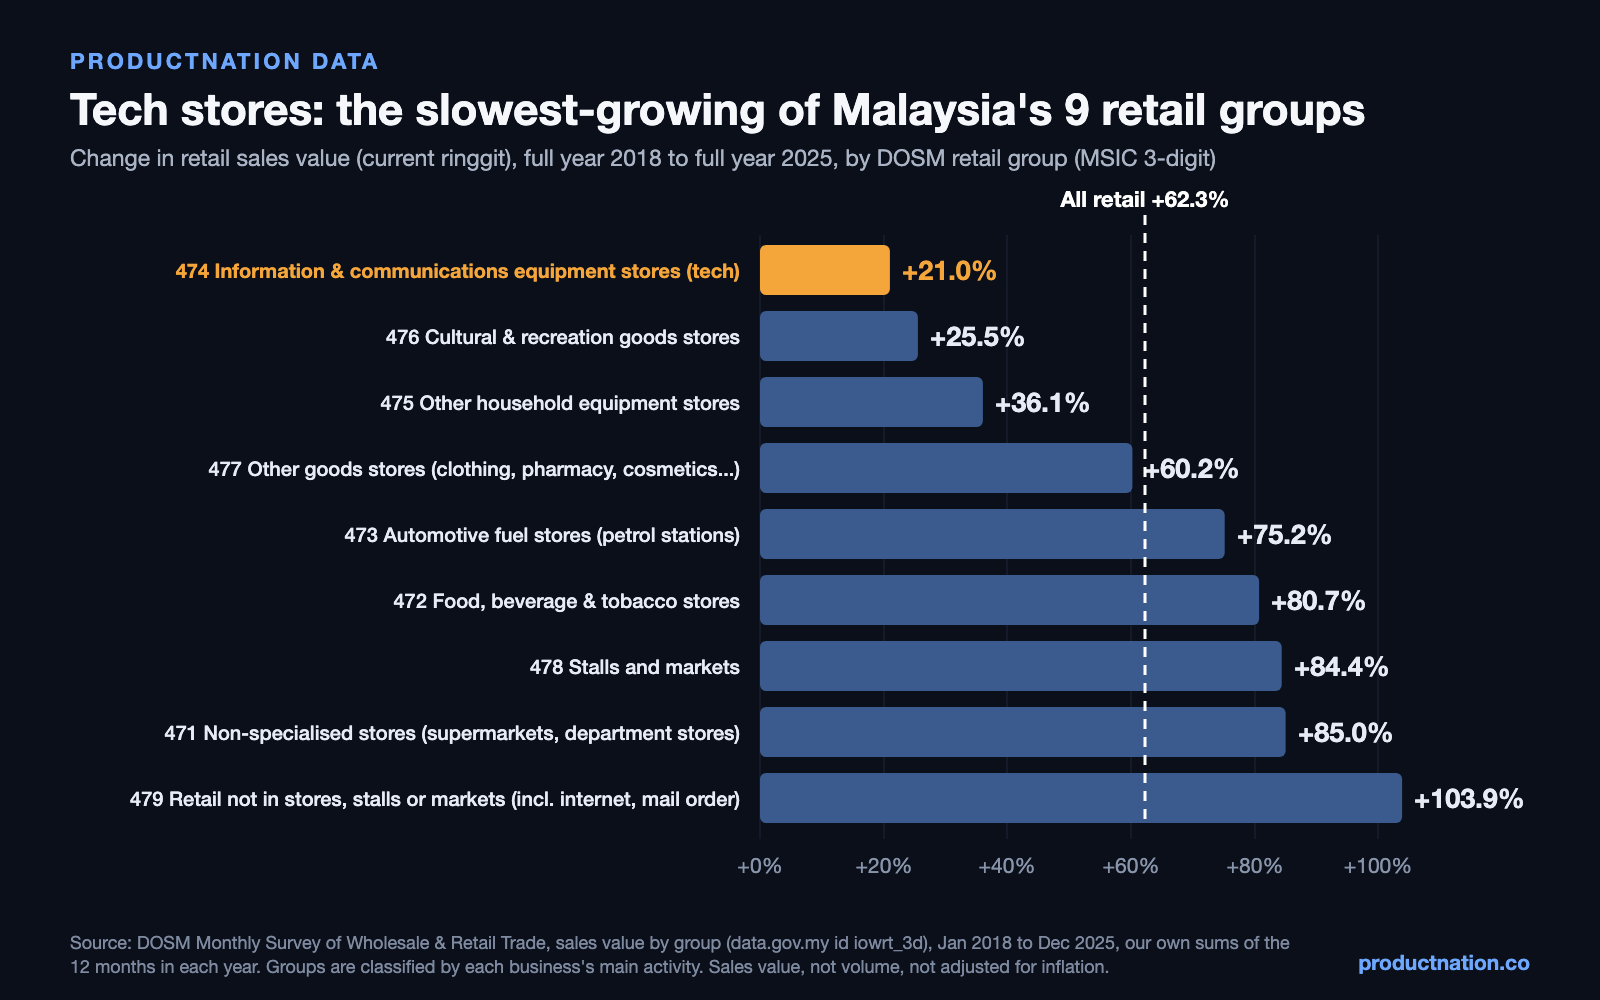
The nine retail groups, 2018 against 2025
Sales value is in current ringgit, as DOSM publishes it, and is not adjusted for inflation. The group names are DOSM's, shortened; the three-digit number is the group's code in the Malaysia Standard Industrial Classification (MSIC).
| DOSM retail group (MSIC) | Sales 2018, RM billion | Sales 2025, RM billion | Change in sales value |
|---|---|---|---|
| 474 Information and communications equipment, specialised stores | 52.03 | 62.96 | +21.0% |
| 476 Cultural and recreation goods, specialised stores | 27.44 | 34.45 | +25.5% |
| 475 Other household equipment, specialised stores | 67.23 | 91.47 | +36.1% |
| 477 Other goods, specialised stores | 106.40 | 170.50 | +60.2% |
| 473 Automotive fuel, specialised stores | 42.84 | 75.05 | +75.2% |
| 472 Food, beverages and tobacco, specialised stores | 28.55 | 51.60 | +80.7% |
| 478 Stalls and markets | 1.43 | 2.64 | +84.4% |
| 471 Non-specialised stores | 169.94 | 314.42 | +85.0% |
| 479 Retail not in stores, stalls or markets | 4.13 | 8.43 | +103.9% |
| All retail (division 47) | 500.0 | 811.5 | +62.3% |
In 2018, tech stores took more in sales than petrol stations (RM52.03 billion against RM42.84 billion). By 2025 the order had reversed, RM62.96 billion against RM75.05 billion.
A shrinking slice of every ringgit spent in shops
Tech stores' share of all retail sales was 10.4 per cent in 2018. It held close to 10 per cent through 2020 (10.0 per cent) and 2021 (10.2 per cent), then fell in each of the next four years: 9.0 per cent in 2022, 8.3 per cent in 2023, 7.9 per cent in 2024 and 7.8 per cent in 2025. In the first eight months of 2026, the latest DOSM has published, the share is 7.6 per cent; that is a part year and we show it only as a share, not as a growth figure.
| Year | Tech store sales, RM billion | All retail sales, RM billion | Tech stores' share |
|---|---|---|---|
| 2018 | 52.03 | 500.0 | 10.4% |
| 2019 | 54.18 | 537.6 | 10.1% |
| 2020 | 50.98 | 511.0 | 10.0% |
| 2021 | 54.63 | 533.6 | 10.2% |
| 2022 | 59.56 | 661.1 | 9.0% |
| 2023 | 59.72 | 720.8 | 8.3% |
| 2024 | 60.02 | 764.9 | 7.9% |
| 2025 | 62.96 | 811.5 | 7.8% |
| Jan to Aug 2026 (part year) | 43.14 | 570.1 | 7.6% |
Sales value is not the whole picture
DOSM also publishes a volume index for each group, which tracks sales volume rather than the ringgit taken (2015 = 100). Averaged over each year, the tech-store volume index rose 32.0 per cent from 2018 to 2025, faster than the 21.0 per cent rise in tech-store sales value. On volume, tech stores are not the slowest group: other household equipment stores and cultural and recreation goods stores each rose 22.1 per cent. So the "slowest of nine" finding is about the money taken, in ringgit, and we say so in the headline. DOSM does not explain why the two measures differ, and we do not claim a reason.
We have reported separately, using a different DOSM dataset (the consumer price index), that the price index for Malaysia's phone, computer and telecom basket was lower in 2026 than in 2010: [Almost Every Price Category in Malaysia Rose Since 2010. The Phone Basket Fell 8.9%](https://productnation.co/my/31989/malaysia-communication-prices-fell-since-2010-021c/). That is related reading on a different measure, period and coverage, not proof of why tech-store sales grew slowly. We have also reported, from DOSM's ICT household survey, how Malaysians get online: [99% of Malaysia's Internet Users Go Online by Phone. Just 40% Use a Laptop](https://productnation.co/my/32063/malaysia-internet-phone-laptop-RKCV/).
What this does and does not say
These figures count shops, not products. DOSM classifies each business by its main activity, so a phone or laptop sold by a hypermarket, a department store or a business classified as non-store retail is counted in that business's group, not in group 474, and anything else a tech store sells is counted in 474. The finding is therefore that the businesses whose main trade is tech equipment grew their sales the least, not that Malaysians spent less on tech goods in total, which this dataset cannot show.
Group 479, retail not in stores, stalls or markets, includes sales by mail order and over the internet and was the fastest-growing group, but it is also the second smallest, RM8.43 billion in 2025, and it does not capture all online shopping: a business whose main activity is a physical store is classified with its store group even if it also sells online. We do not read group 479 as a measure of online shopping in Malaysia.
The sales figures are in current ringgit and are not adjusted for inflation. They come from DOSM's Monthly Survey of Wholesale and Retail Trade, which covers registered businesses and, where a business's accounts are incomplete, uses DOSM's best available estimates. We do not claim a cause for any group rising or falling; the data shows what moved and by how much, not why.
How to reproduce this
Download iowrt_3d.parquet from DOSM (storage.dosm.gov.my/iowrt/iowrt_3d.parquet, also on data.gov.my as the catalogue item "Wholesale and Retail Trade by Group (3 digit)", id iowrt_3d). Keep the rows where series is "abs" and the group starts with 47. For each group, add up the sales column (RM million) for the twelve months of 2018 and the twelve months of 2025, and take the change. The nine groups add up exactly to DOSM's own total for retail division 47 in iowrt_2d.parquet. For the volume figures, average the volume column over the twelve months of each year. The group labels are DOSM's, from storage.dosm.gov.my/dictionaries/msic.parquet. August 2026 is the latest month published; DOSM lists the next update as 13 November 2026.