It is easy to assume the whole country went cashless at once. The record is more interesting than that. We pulled Bank Negara Malaysia's payment statistics from data.gov.my, the series that splits every card payment by whether the card was used in person or online, and counted it month by month from the start of the series in April 2019 to June 2026. Credit cards and debit cards behaved very differently. Online spending rose on both, but only the credit card pushed past the halfway mark, and from 2020 it stayed above half in every complete year. The debit card never came close.
Contents
- The credit card became majority-online in 2020
- The debit card rose too, but never crossed half
- The twist: by the number of purchases, the credit card is still mostly used in person
- The numbers, in full
- How Malaysians used their cards in 2025, in ringgit
- The limits, so you can trust the numbers
- How to check this yourself
The credit card became majority-online in 2020
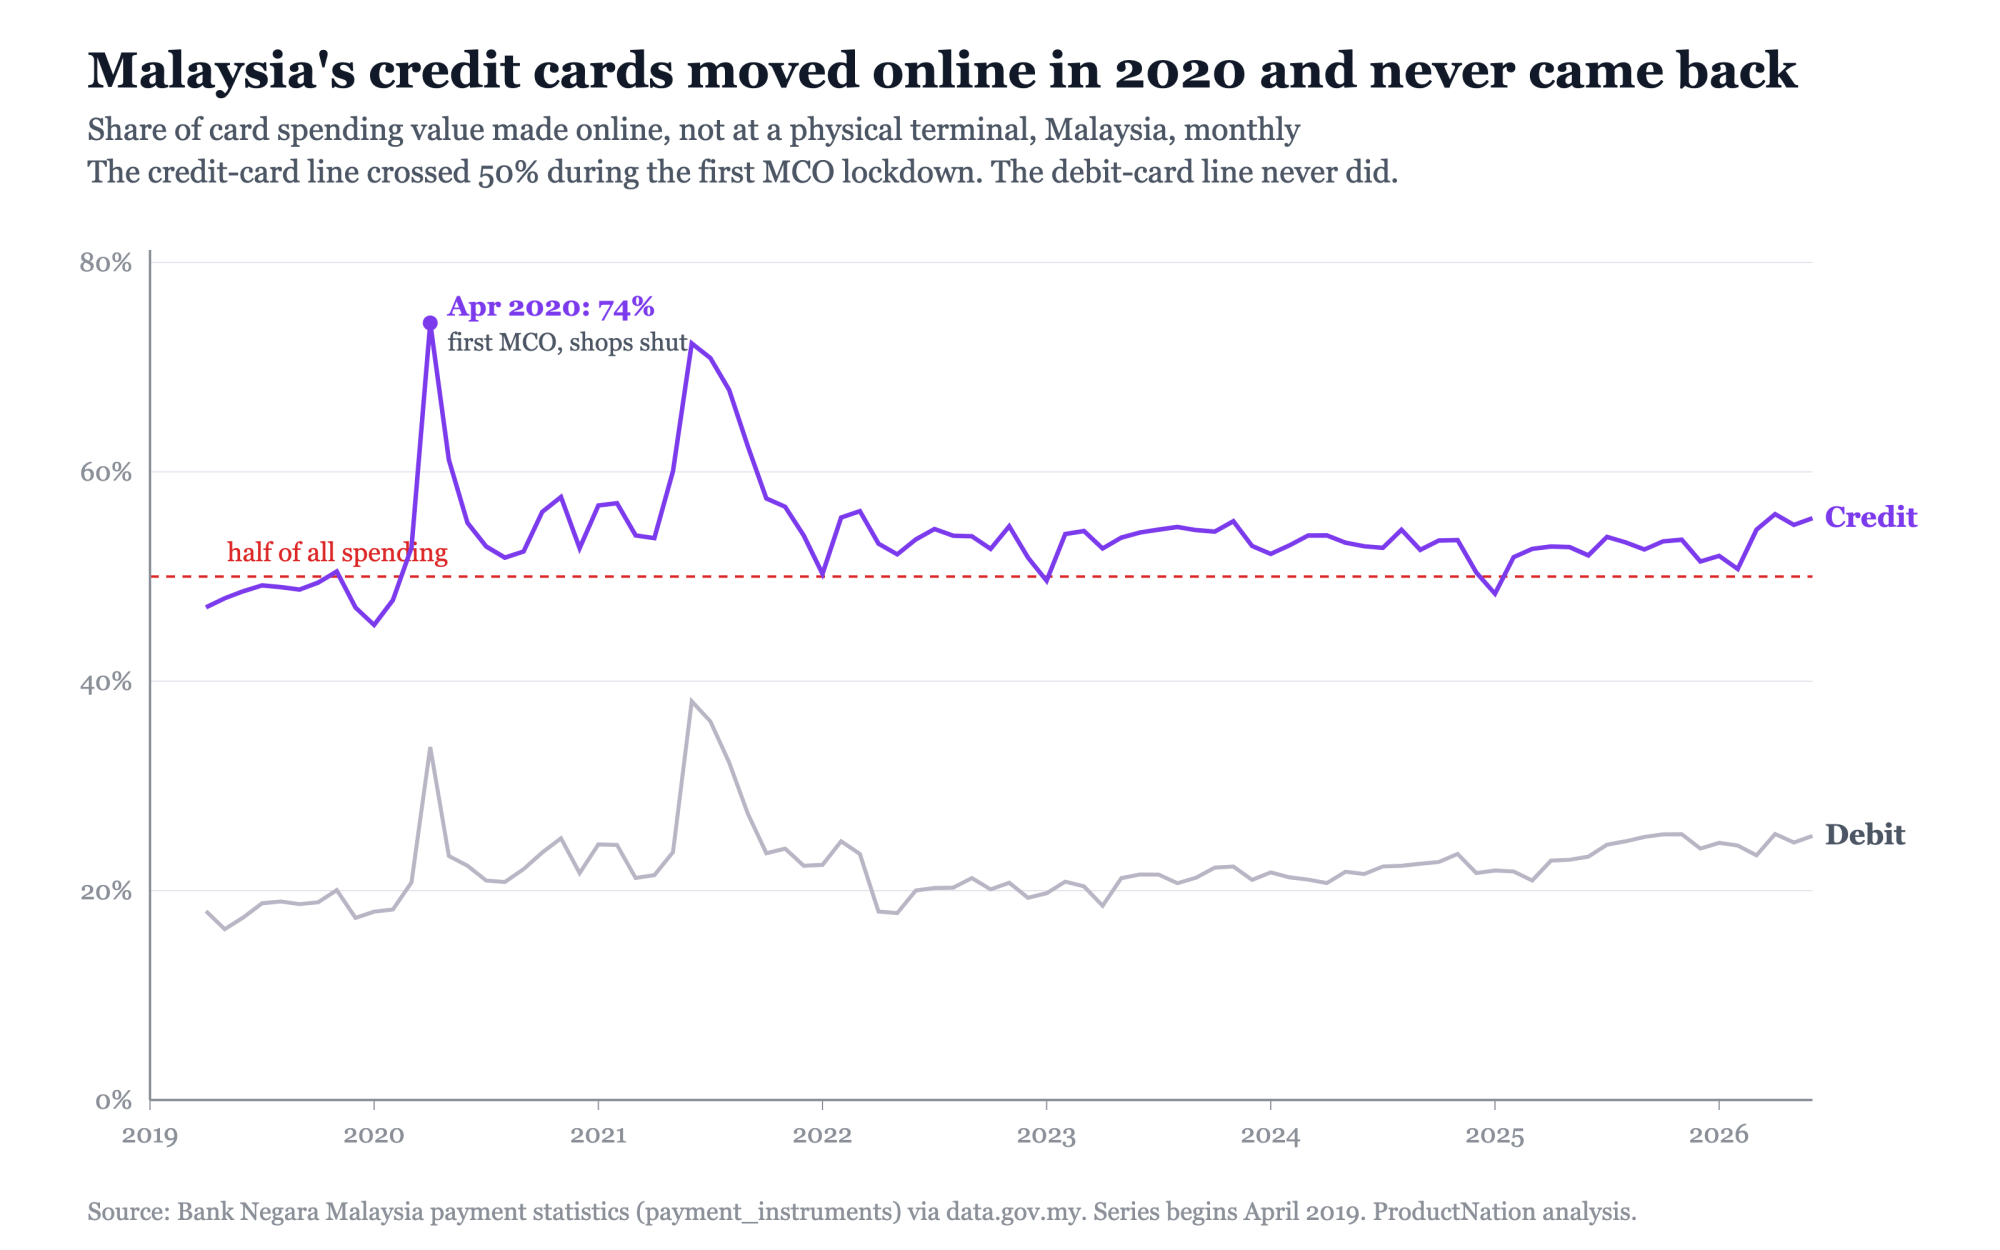
In 2019 the credit card was still mostly a thing you handed to a cashier. Over the nine months the data covers that year, from April to December, 48.6 per cent of credit-card spending by value went through online channels and the rest in person. The online share sat just under half most months, touching 50.5 per cent once in November 2019 before slipping back below half.
Then it jumped. In March 2020, the month Malaysia entered its first Movement Control Order, the online share of credit-card value reached 52.8 per cent. In April 2020, the first full month under that order, it spiked to 74.2 per cent, its highest in the whole series. We are not claiming the lockdown was the only cause, but the timing lines up closely. What is striking is what happened next: it did not fully reverse. For the full year 2020 the online share was 53.9 per cent, the first complete year online outweighed in-person, and it has stayed above half in every complete year since: 59.6 per cent in 2021, 53.5 per cent in 2022, 53.7 per cent in 2023, 53.0 per cent in 2024 and 52.4 per cent in 2025. In the first half of 2026 it was 53.9 per cent. What briefly touched half in late 2019 became a settled annual majority from 2020 on.
The debit card rose too, but never crossed half
The same dataset tells a different story for debit cards. Online debit spending rose as well, but it never came close to taking over. Its share of debit-card value went from 18.3 per cent in 2019 (April to December) to 23.5 per cent in 2025, and the highest it reached in any full year was 25.7 per cent in 2021. In 2025, more than three-quarters of all debit-card spending, 76.5 per cent, still happened in person. Across this series the debit card has stayed mainly a way to pay in a shop, even as the credit card moved online.
The twist: by the number of purchases, the credit card is still mostly used in person
There is a catch that stops this being a simple "everything moved online" story, and it is the part worth understanding. The online majority is measured in ringgit, not in the number of purchases. Counted by the number of transactions, in-person credit-card payments still outnumber online ones: in 2025 there were 596 million in-person credit-card transactions against 433 million online, so only 42 per cent of credit-card purchases were made online. The reason online leads on value while trailing on volume is arithmetic: the average online credit-card transaction in 2025 was RM275, well above the RM182 average in person. More credit-card purchases are made in a shop, but each online purchase is larger, so more credit-card money moves online than in person. Both figures are true at once, and they measure different things.
The numbers, in full
Online share of card spending by value, each year, with 2019 covering April to December because the series begins in April 2019.
| Year | Credit card, online share of value | Debit card, online share of value |
|---|---|---|
| 2019 (Apr to Dec) | 48.6% | 18.3% |
| 2020 | 53.9% | 22.1% |
| 2021 | 59.6% | 25.7% |
| 2022 | 53.5% | 20.4% |
| 2023 | 53.7% | 20.9% |
| 2024 | 53.0% | 21.9% |
| 2025 | 52.4% | 23.5% |
| 2026 (Jan to Jun) | 53.9% | 24.5% |
How Malaysians used their cards in 2025, in ringgit
| In 2025 | Online | In person | Online share |
|---|---|---|---|
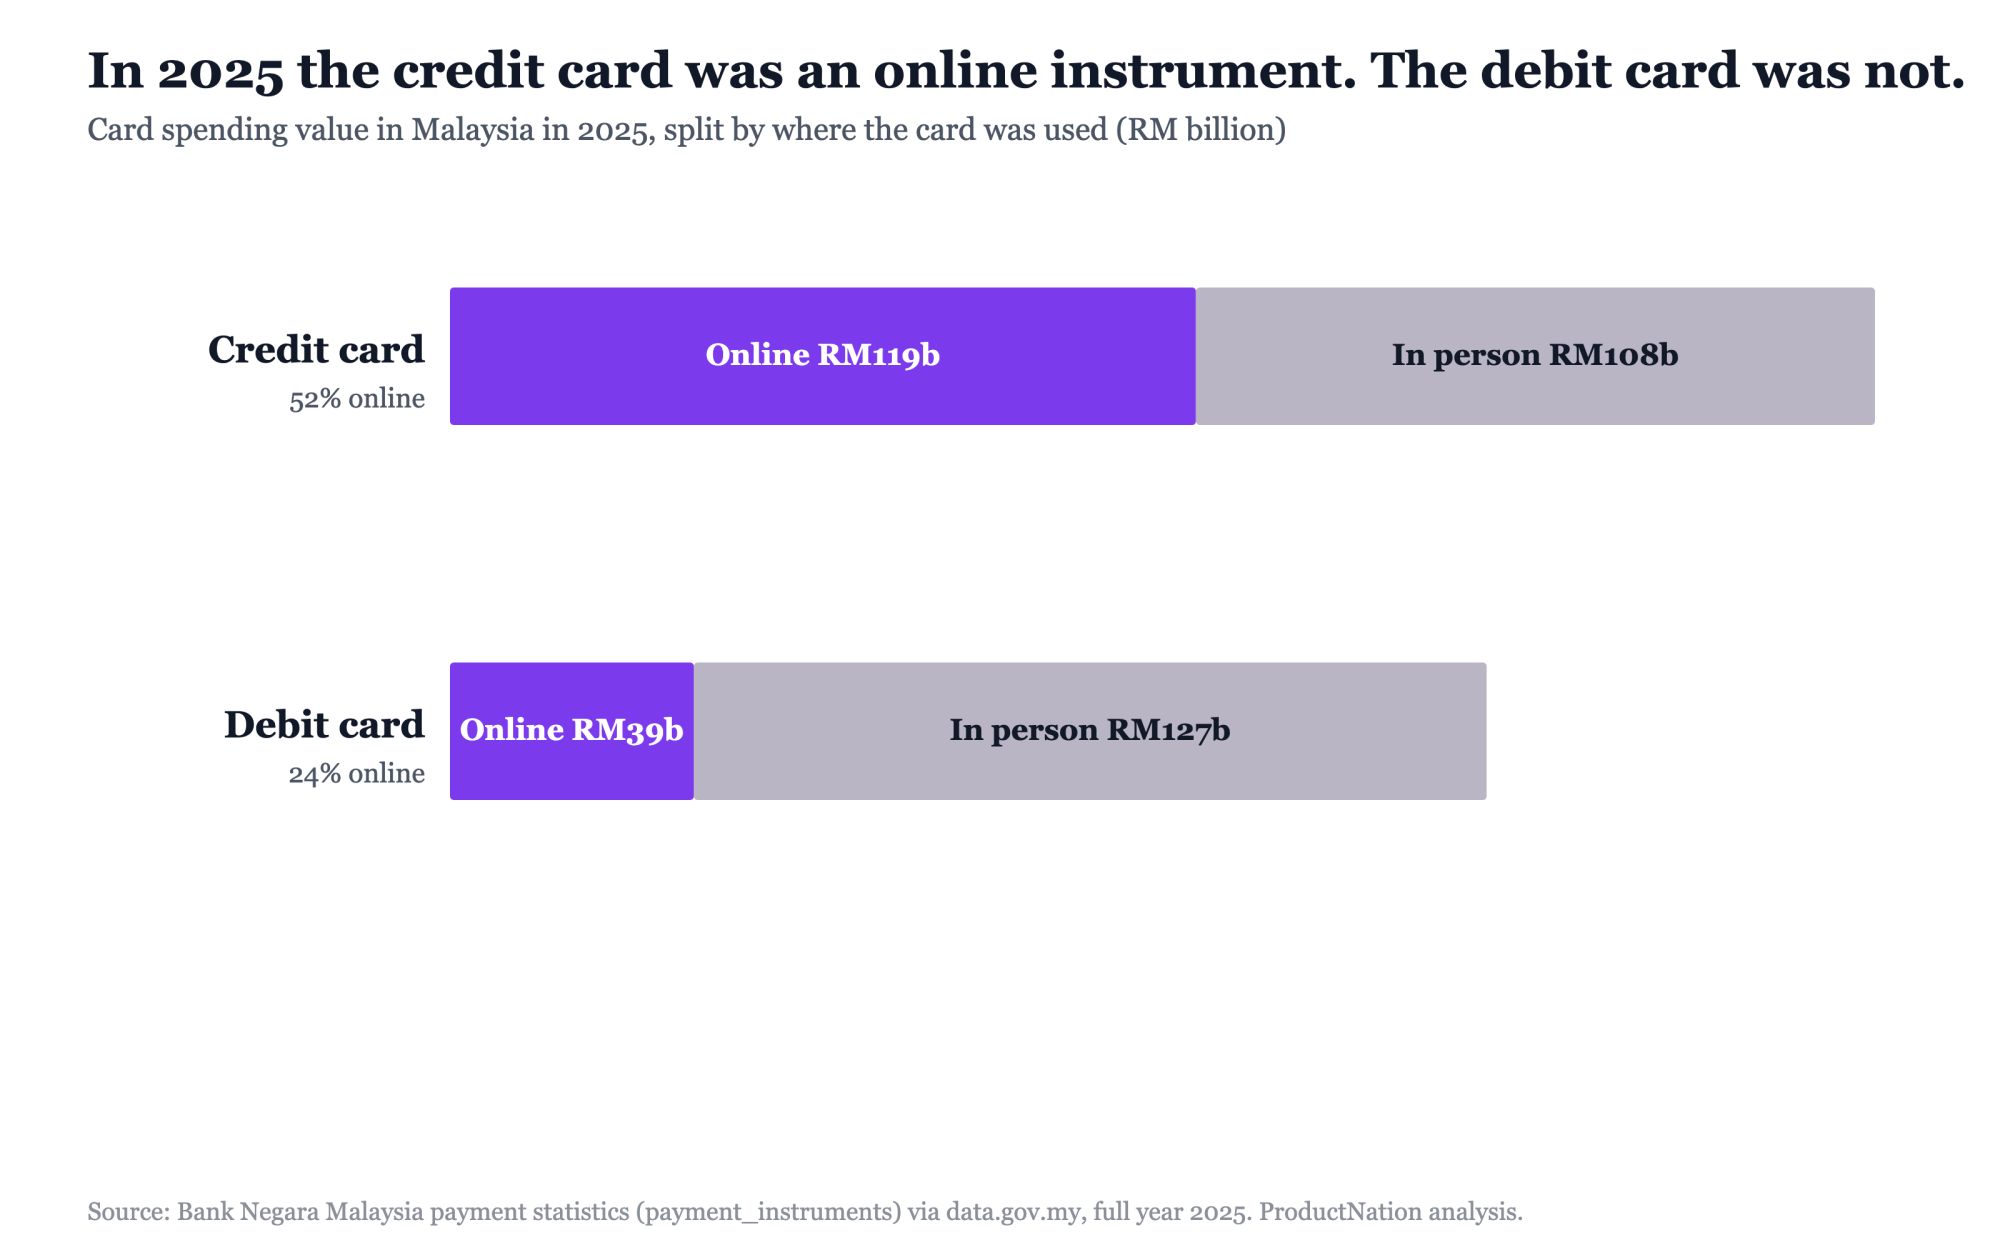
| Credit card spending (value) | RM119.2 billion | RM108.5 billion | 52.4% |
| Debit card spending (value) | RM39.0 billion | RM126.6 billion | 23.5% |
| Credit card transactions (count) | 433 million | 596 million | 42.0% |
| Average credit-card transaction | RM275 | RM182 | - |
The limits, so you can trust the numbers
These figures are the ringgit value and the number of card transactions, as recorded by Bank Negara Malaysia, not a count of people or a measure of sales. The data.gov.my dataset labels the two channels face-to-face and online, and those are the words we use. In Bank Negara's underlying statistics the online channel corresponds to its card-not-present category, which is predominantly internet purchases but can also include a smaller share of mail-order and telephone-order payments, so online here means card-not-present spending rather than strictly web checkouts. The definitions are Bank Negara's. The series begins in April 2019, so 2019 is a nine-month figure and we have not compared it as a full year against later years; every yearly comparison here is between complete calendar years from 2020 onward, with 2026 shown only as a part year to January to June. This is card spending only. It is not the whole cashless picture: instant transfers through DuitNow and e-wallet payments sit in separate Bank Negara series, and we covered those growth figures in an earlier piece. Charge cards, a small third category, are left out of these two-card comparisons.
How to check this yourself
The data is public. Open data.gov.my and take the payment instruments dataset, whose source is Bank Negara Malaysia. For credit cards, add up the monthly value of the "credit online" rows across a year and the "credit face-to-face" rows across the same year, then divide online by the total; repeat for the two debit rows. Do it for each year from 2020, the first complete year in the series, and you will see the credit-card online share sit above half every year while the debit-card share stays near a quarter. The monthly figures are what we charted, and the single highest credit-card month is April 2020.