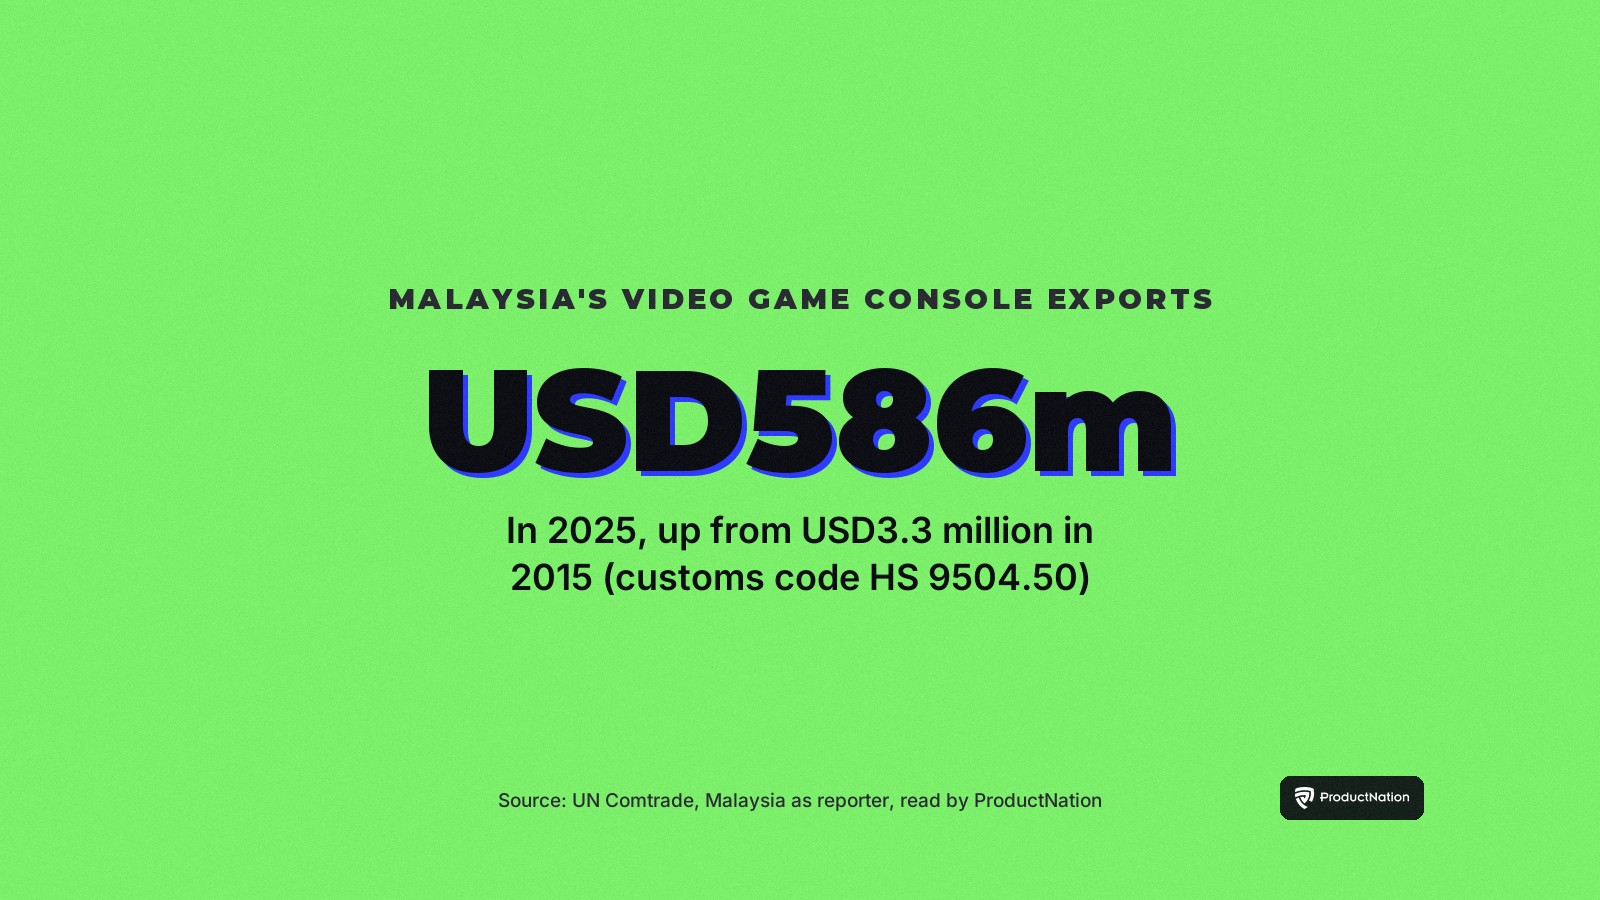
In 2015 Malaysia exported USD3.3 million of goods under the customs code for video game consoles and machines. In 2025 it exported USD585.9 million, about 177 times as much (USD585.9 million against USD3.31 million).
We read the figures from UN Comtrade, the United Nations database of the trade statistics each country reports, for customs code HS 9504.50 ("video game consoles and machines, other than those of subheading 9504.30", which is the coin-operated kind). Then we checked them against the mirror records that buying countries report. On the US side the two are within 6% of each other.
Contents

The numbers, year by year
| Year | Malaysia's exports, HS 9504.50 (USD million) |
|---|---|
| 2015 | 3.3 |
| 2016 | 4.0 |
| 2017 | 8.4 |
| 2018 | 11.5 |
| 2019 | 12.6 |
| 2020 | 128.1 |
| 2021 | 197.7 |
| 2022 | 219.4 |
| 2023 | 653.9 |
| 2024 | 360.3 |
| 2025 | 585.9 |
The rise was not smooth. Exports stayed under USD13 million a year until 2019, then jumped roughly tenfold to USD128.1 million in 2020. They peaked at USD653.9 million in 2023, fell to USD360.3 million in 2024 and climbed back to USD585.9 million in 2025, which is still below the 2023 peak.
Recorded as Malaysian exports, not re-exports
A big export number can simply mean goods arriving and leaving again. Malaysia's own records separate the two. For 2025 it reported importing USD32.7 million of goods under the same code and recording just USD0.9 million as re-exports; the rest of the USD585.9 million is recorded as Malaysia's own exports. Trade records classify shipments; they do not show how much of each machine was made here, or how many of its parts were imported under other codes.
Two buyers took most of it in 2025, according to Malaysia's figures: the United States (USD269.3 million, 46%) and the Netherlands (USD241.5 million, 41%). Canada (USD24.1 million), Uruguay (USD22.0 million) and Mexico (USD15.6 million) followed.
What the American records show
The United States reports its own imports to the same database, which gives a mirror record reported separately by the buyer. US records show USD2.0 million of these goods arriving from Malaysia in 2015, USD133.5 million in 2024 and USD287.7 million in 2025. That 2025 figure includes freight and insurance (the CIF value); the US record's value at the exporter's border (FOB) is USD285.3 million, against the USD269.3 million Malaysia reports shipping to the US on the same FOB basis, a difference of 5.9%. We have not broken that difference down.

The same US records put Malaysia's rise in proportion. In 2015 China supplied USD4.74 billion of the USD4.83 billion of these goods the US imported, 98.2%, and Malaysia supplied 0.04%. In 2025 the US imported USD6.73 billion: Vietnam supplied 55.8% (USD3.75 billion), China 24.6% (USD1.66 billion) and Malaysia 4.27%. Malaysia's share is small, but it went from almost nothing to about 1 in every 23 dollars of US imports under this code.
What this does and does not tell you
These are values, not unit counts. The figures are US dollars at the prices of each year, not adjusted for inflation, so they mix the number of machines shipped with what each one was worth. A shift to dearer machines would raise the total without more units being made.
The customs code is wider than "a console in a box". Under the customs rules for this chapter (Chapter 95, note 3), parts and accessories used solely or mainly with these machines are classified with them. So the totals can include controllers and other parts, not only finished consoles.
The records do not name the companies. Trade statistics are counted by product code and country, not by brand or factory. We have not identified which manufacturers account for these exports, and nothing here should be read as a claim about any particular brand or console.
The Dutch figures do not match. Malaysia reports USD241.5 million shipped to the Netherlands in 2025, while the Netherlands reports only USD13.8 million received from Malaysia. We cannot reconcile that gap from these records. Rotterdam is a common entry point for goods bound elsewhere in Europe, and countries record such shipments under different rules, but that is a possible explanation, not one we have shown. This is why we lean on the US figures for the independent check.
The latest year can be revised. 2025 figures are as reported to UN Comtrade and read on 15 November 2026.
How to check our numbers
Every figure here comes from the public UN Comtrade API (comtradeapi.un.org), annual data, HS classification, commodity code 950450. Malaysia's exports: reporter 458, flow X, partner 0 (world), one call per year from 2015 to 2025. Malaysia's imports and re-exports for 2025: flows M and RX. The US side: reporter 842, flow M, with partner 458 (Malaysia), 156 (China), 704 (Vietnam) and 0 (world) for 2015 and 2025. The Netherlands: reporter 528, flow M, partner 458, 2025. We saved every API response and the file that totals them in our research records, so each figure can be traced to the exact response it came from.